
Rowan University Rowan University
Rowan Digital Works Rowan Digital Works
Theses and Dissertations
6-6-2018
Making college admission count: the importance of admission Making college admission count: the importance of admission
criteria in the current undergraduate admission process criteria in the current undergraduate admission process
Amanda Rachel Tessler
Rowan University
Follow this and additional works at: https://rdw.rowan.edu/etd
Part of the Higher Education Commons
Recommended Citation Recommended Citation
Tessler, Amanda Rachel, "Making college admission count: the importance of admission criteria in the
current undergraduate admission process" (2018).
Theses and Dissertations
. 2574.
https://rdw.rowan.edu/etd/2574
This Thesis is brought to you for free and open access by Rowan Digital Works. It has been accepted for inclusion
in Theses and Dissertations by an authorized administrator of Rowan Digital Works. For more information, please
contact graduateresearch@rowan.edu.
!
!
MAKING COLLEGE ADMISSION COUNT: THE IMPORTANCE OF
ADMISSION CRITERIA IN THE CURRENT UNDERGRADUATE
ADMISSION PROCESS
by
Amanda Tessler
A Thesis
Submitted to the
Department of Educational Services and Leadership
College of Education
In partial fulfillment of the requirement
For the degree of
Master of Arts in Higher Education
at
Rowan University
May 1, 2018
Thesis Chair: Burton R. Sisco, Ed.D.
!
!
© 2018 Amanda Rachel Tessler
!
!
Dedication
I would like to dedicate this to my parents. Thank you both for always pushing me
to do better and supporting me, not only in graduate school, but my personal life as well.
Without you, I would have never found myself in graduate school with aspirations of
continuing my education and becoming the doctor in the family. Because of you, I am
always pushing myself harder, and wanting even more for myself. Thank you both.
iv
!
Acknowledgments
First, I would like to thank my family for supporting me throughout grad school.
Thank you for letting me miss holidays and being so understanding when you could not
see me for months at a time.
I would also like to thank my friends and coworkers for encouraging me,
understanding how busy I have been over the past two years, letting me vent, and
listening to me complain and stress over the work I needed to do. Now that this is
finished, I can finally have a social life with you all again!
Thank you to my boyfriend who has only known me as a graduate student and has
stuck around this whole time. Thank you for supporting me, letting me cancel plans, and
staying in at night and on weekends with me when I was too tired to do anything. I
definitely could not have done it without you.
Lastly, thank you to Dr. Sisco for his guidance and knowledge throughout these
past two years. With your support, I gained a deeper knowledge and stronger passion for
research.
v!
!
Abstract
Amanda Tessler
MAKING COLLEGE ADMISSION COUNT: THE IMPORTANCE OF ADMISSION
CRITERIA IN THE CURRENT UNDERGRADUATE ADMISSION PROCESS
2017-2018
Burton R. Sisco, Ed.D.
Master of Arts in Higher Education
During these changing times in higher education, admission criteria for being
accepted into a four-year institution for higher education continues to evolve. This study
discovered the attitudes that guidance counselors and admission officers, from public
schools throughout New Jersey, had about these criteria, and what they believed is most
important for current students applying to college. Two surveys were developed and
distributed via email to guidance counselors of public high schools throughout New
Jersey, as well as admission officers of public four-year institutions throughout New
Jersey. Results suggest that quantitative admission criteria, SAT and ACT scores and
HSGPA, are the most important, and also course load and transcript. Further research
should look to discover the reasoning behind why each of these are so important, as well
as looking to discover how important these admission criteria are to students currently
applying to college.
hi
vi!
!
Table of Contents
Abstract ............................................................................................................................v
List of Tables ...................................................................................................................ix
Chapter I: Introduction .....................................................................................................1
Statement of the Problem ...........................................................................................1
Purpose of the Study ..................................................................................................1
Significance of the Study ...........................................................................................2
Assumptions and Limitations ....................................................................................2
Operational Definitions ..............................................................................................3
Important Acronyms ..................................................................................................4
Research Questions ....................................................................................................4
Overview of the Study ...............................................................................................5
Chapter II: Review of the Literature ................................................................................6
Current Admissions Process and Requirements ........................................................6
Quantitative Admission Criteria ................................................................................9
Standardized Testing ............................................................................................9
High School GPA ................................................................................................14
Class Rank ...........................................................................................................14
Qualitative Admission Criteria ..................................................................................15
Extracurricular Activities .....................................................................................16
Personal Essays ....................................................................................................17
Letters of Recommendation .................................................................................18
Interviews .............................................................................................................19
vii!
!
Table of Contents (Continued)
District Factor Grouping (DFG) ..........................................................................20
Course Load and Transcript .................................................................................20
The Role of High School Guidance Counselors ........................................................21
Job Description ....................................................................................................21
Role in the Application Process ...........................................................................21
Importance of Understanding College Admissions .............................................22
Summary of the Literature Review ............................................................................23
Chapter III: Methodology ................................................................................................25
Context of Study ........................................................................................................25
Population and Sampling ...........................................................................................33
Data Collection Instruments ......................................................................................34
Data Collection Procedures ........................................................................................36
Data Analysis .............................................................................................................37
Chapter IV: Findings ........................................................................................................38
Profile of the Sample: Guidance Counselors and Admission Counselors .................38
Analysis of the Data ...................................................................................................41
Research Question 1 ............................................................................................41
Research Question 2 ............................................................................................45
Research Question 3 ............................................................................................46
Chapter V: Summary, Discussion, Conclusions, and Recommendations .......................48
Summary of the Study ...............................................................................................48
Discussion of the Findings .........................................................................................48
viii!
!
Table of Contents (Continued)
Research Question 1 ............................................................................................48
Research Question 2 ............................................................................................50
Research Question 3 ............................................................................................51
Conclusions ................................................................................................................52
Recommendations for Practice ..................................................................................53
Recommendations for Further Research ....................................................................53
References ........................................................................................................................55
Appendix A: Institutional Review Board Approval ........................................................58
Appendix B: Initial Email to Potential Subjects ..............................................................59
Appendix C: Reminder Email to Potential Subjects ........................................................60
Appendix D: Online Alternate Consent Form .................................................................61
Appendix E: Survey for Admission Officers ...................................................................63
Appendix F: Survey for Guidance Counselors ................................................................65
ix!
!
List of Tables
Table Page
Table 3.1. Institutions Used for Data Collection .............................................................25
Table 3.2. School Districts Used for Data Collection with A-C DFG Rating .................26
Table 3.3. School Districts Used for Data Collection with D-F DFG Rating .................29
Table 3.4. School Districts Used for Data Collection with G-I DFG Rating ..................31
Table 4.1. Demographics of Guidance Counselors (N=232) ...........................................39
Table 4.2. Demographics of Admission Officers (N=47) ...............................................40
Table 4.3. Guidance Counselors' Attitudes Towards Admission Criteria (N=232) ........42
Table 4.4. Admission Officers' Attitudes Towards Admission Criteria (N=47) .............44
Table 4.5. Importance of Admission Criteria Means for Guidance Counselors and
Admission Officers ..........................................................................................46
Table 4.6. Read Any Past/Current SAT Research (N=279) ............................................47
Table 4.7. Belief of Which Criterion Best Predicts Academic Success (N=279) ............47
1
Chapter I
Introduction
The college admission process continues to evolve, adapt, and grow as the world
continues to change. Many requirements have held over the years, including standardized
test scores, letters of recommendation, and high school grade point average. However,
there is no consistent understanding of the importance of each of these requirements.
Each institution is different, whether it is public or private, small or large. Admission
offices and institutions look for different criteria in potential students. In order for high
school seniors to successfully navigate the collegiate admission process, they look to
their guidance counselors for advice.
Statement of the Problem
Since the types of institutions vary, each one operating and expecting different
standards from potential students, there is a common question of, “What are the most
important qualifications for a student to be accepted into a four-year institution?”
Guidance counselors in high schools are supposed to guide their students through the
college application process. However, since every institution weighs admission criteria
differently, consistency and knowledge about what criteria are the most important when
applying to college has declined.
Purpose of the Study
The purpose of this study was to discover and compare the attitudes of selected
high school guidance counselors and college admission officers regarding the admission
criteria used in selecting college applicants. The study sought to focus on what is most
important for being accepted into an undergraduate program at a four-year public college
2
in New Jersey, as well as discovering the similarities and differences between the
attitudes of the subjects. The admission criteria selected were general requirements that
have a research and knowledge base on their predictability of first-year academic success.
Therefore, the goal of this study was to make the admission process easier to understand
for high school students in New Jersey.
Significance of the Study
This study looks to provide insight into the college admission process from the
perspectives of high school guidance counselors and admission officers. By discovering
the importance of admission criteria between these two subject groups, gaps in the
knowledge base can be closed. This can lead to more success for guidance counselors in
helping their students be accepted into a college in New Jersey by understanding the
admission process from the perspective of admission officers of these colleges.
Assumptions and Limitations
First, this study assumes that all subjects answered the survey fully and honestly,
based off of what is used in practice. A number of correlations may be found, but they
should not be used to generalize the population of high schools and higher education
institutions’ roles in college admissions. New Jersey high schools and colleges only
represent a small percentage of postsecondary institutions in the United States with
possible different standards of schools. The public-school system varies from state-to-
state and cannot be generalized. There also may be researcher bias since I worked as a
graduate intern in the Rowan University Admission’s Department during the time of the
study. This could have affected my understanding of the importance of varied admission
3
criteria and the admission process, as well as develop my own biases towards specific
criteria.
Operational Definitions
1. Academic Success: Meeting the institution’s expectations for students,
including retention and GPA.
2. Admission Officer: An employee of an institution’s Admissions Department
whose job is to recruit and select students to attend the institution.
3. Admission Requirements: Required criteria used to determine acceptance into
the institutions located in the state of New Jersey who were studied for this
research. This study looked at standardized test scores (SAT and ACT), high
school GPA, class rank, extracurricular activities, personal essays, letters of
recommendation, interviews, District Factor Grouping, and course load and
transcripts.
4. Guidance Counselor: An employee of a public New Jersey high school who
works in the high school’s guidance office and assists students in the college
application process.
5. Institution: A four-year public college or university in New Jersey that utilizes
an admissions department and a set of admission requirements to select their
students.
6. Qualitative Criteria: Requirements to submit to four-year institutions that focus
on personal qualities and characteristics. The qualitative criteria used in this study
were extracurricular activities, personal essays, letters of recommendation,
interviews, District Factor Grouping, and course load and transcripts.

4
7. Quantitative Criteria: Requirements to submit to four-year institutions that are
measurable. The quantitative criteria used in this study were standardized test
scores (SAT and ACT), high school GPA, and class rank.
8. Standards: Minimum and maximum requirements to be accepted into an
institution.
9. Student: A high school senior applying to a four-year college or university with
potential to attend the next year. The students referred to in this study were
seniors during the 2017-2018 school year in the state of New Jersey.
Important Acronyms
1. DFG: District Factor Grouping
2. FYGPA: First Year (of college) Grade Point Average
3. HSGPA: High School Grade Point Average
4. SATC: SAT Combined Score
5. SATM: SAT Math Score
6. SATV: SAT Verbal Score
7. SATW: SAT Writing Score
Research Questions
This study sought to explore three questions:
1. What are the most important admission criteria according to selected admission
officers and guidance counselors in New Jersey?
2. What similarities or differences are found between these two groups and their
attitudes towards current college requirements?

5
3. Do the subjects’ attitudes towards the chosen admission criteria correlate to the
literature on the predictability of student academic success?
Overview of the Study
Chapter II reviews relevant literature on current admission processes and
requirements in four-year institutions. The review looks at both quantitative and
qualitative admission criteria, including standardized tests, high school GPA, class rank,
extracurricular activities personal essays, letters of recommendation, interviews, District
Factor Grouping, and course load and transcripts. This chapter discusses each of the
criteria used in this study, including discussions on predictability of first-year college
academic success and the general uses of each of the criteria in the admissions process.
Chapter III describes the procedures and methodologies used in this study. In this
chapter are explanations of the target population and sample, explanations of the high
schools and colleges selected, data collection methods, instruments, and data analysis
measures.
Chapter IV presents the findings and results of the study. This chapter looks at the
results found and compares the findings to the initial research questions. This chapter also
looks at the demographics of the subjects.
Chapter V discusses the significant findings, offers conclusions, and discusses
suggestions for practice and further research.
6
Chapter II
Review of the Literature
Current Admissions Process and Requirements
The current college admission process varies from institution to institution.
Procedures are general among them, but the specific requirements and standards vary due
to competitiveness of each institution. Applications typically include an application form,
high school transcript, standardized test scores, letters of recommendation, and personal
essay. Admission departments look at these and other criteria submitted by an applicant
to make their admission decision. The criteria can be broken down into two categories:
quantitative and qualitative. The quantitative criteria are measurable requirements,
including grades and test scores. The qualitative criteria focus on personal qualities and
characteristics. These criteria include letters of recommendation, personal essays, and
interviews.
The varied admission criteria and standards stem from the differences in
importance of each of the admission criteria used by admissions officers and the
institution. Some admission officers believe that the quantitative criteria are most
important due to the research on predictability of student success, while others believe
that qualitative criteria show personal characteristics of a student that academic
performance may hide.
The National Association for College Admission Counseling (NACAC)
distributes their Admission Trends Survey (ATS) each year. The 2015 survey received 687
responses from institutions across the country, and collected data on application volume,
wait lists, Early Decision and Early Action, and most important factors in admission
7
decisions (National Association for College Admission Counseling [NACAC], 2016).
The criteria used most in admission decisions in Fall 2015, according to the institutions
surveyed, were high school grades and GPA, strength of curriculum, and standardized
test scores (NACAC, 2016).
Admissions departments often lean towards using either a formulaic or holistic
review process while making admissions decisions (Richmond, 2011; Tremblay, 2013).
A formulaic approach focuses on the quantitative admissions criteria of potential
students, which includes standardized test scores, high school GPA (HSGPA), and high
school class rank (McGinty, 2004). Often when using this approach, admissions officers
use a rubric or formula to make their admissions decision (Atkinson, 2001; McGinty,
2004). These rubrics and formulas have minimum and maximum scores that the applicant
must have to be accepted. Institutions pride themselves on raising their average scores
each year, by admitting more competitive students and raising their average test scores
and GPAs of incoming freshmen. Administrators in favor of this quantitative admissions
approach argue that research has shown that test scores, combined with grades, can
predict first-year academic success better than just grades alone (Zwick, 2007b).
A holistic approach to admissions decisions involves looking at more than simply
the candidate’s academic achievements, but takes into consideration both quantitative and
qualitative criteria of the applicant (Carlock, 2014; Gilroy, 2007; Hornberger, 2010;
Richmond, 2011). The criteria reviewed include extracurricular activities, including role
in the community and public service (Carlock, 2014). Institutions who use this approach
for admissions decisions look at these aspects of a student’s life as well as their academic
achievement and standardized test scores (Carlock, 2014). Looking at a potential
8
student’s application through a holistic perspective can “help all students, especially low-
income and minority students, determine their educational destinies” (Atkinson, 2001, p.
139). The holistic approach can help administrators understand an applicant’s character
and personal qualities as well as their academic potential.
Guidance counselors serve as a liaison between students and college admission. A
successful admission process relies on the assistance of high school guidance counselors.
One of the main responsibilities of a high school guidance counselor is assistance with
college applications (NACAC, 1990). Because of this, counselors need to know what
institutions, more specifically admission officers, are looking for in potential students.
Applicants need to be informed of what is most important to be accepted into an
institution, which is where guidance counselors come into play (Ishop, 2008). Multiple
studies have indicated that both admission officers and guidance counselors believe
academic factors were the most important in college admission criteria. However, they
did differ in their opinions on individual admission criteria (Gaitlin, 1997; Getler, 2007).
This study compares the importance of specific college admission criteria to
admission officers and high school guidance counselors. Quantitative and qualitative
admission criteria were included in this study. The quantitative criteria were standardized
testing, SAT and ACT scores, HSGPA, and class rank. The qualitative criteria were
extracurricular activities, personal essays, letters of recommendation, interviews, District
Factor Grouping (DFG), and course load and transcripts. This chapter discusses each of
the criteria used in the study, including discussions on predictability of first-year
academic success and the uses of each criterion in the admissions process.
9
Quantitative Admission Criteria
Standardized testing. Standardized testing for college admissions was first
established during the early twentieth century (Zwick, 2007b). During that time, there
were an abundance of entrance examinations that differed between institutions (Zwick,
2007b). In 1900, to try and standardize college admission testing, 12 leaders from the top
northeastern universities formed the College Entrance Examination Board (Zwick,
2007b). The SAT was first implemented in 1926 and, since then, has been praised for its
reliability and validity in predicting academic success in college freshmen (NACAC,
2016; Zwick, 2007b).
The SAT and ACT are the two most commonly used standardized tests.
According to the ATS survey, 78% of colleges who responded require either the SAT or
the ACT for admission with 3% requiring the SAT specifically (NACAC, 2016).
As of March 2016, the SAT was redesigned “to develop an assessment that better
reflects the work that students will do in college” (Shaw et al., 2016, p. 5). The
redesigned test includes three sections: reading and writing, math, and an optional essay
portion (Shaw et al., 2016). Both reading and writing and math sections are scored on a
200-800 scale with subscores on a 10-40 scale (Shaw et al., 2016). A validity study was
completed for the redesigned SAT in the fall of 2014 (Shaw et al., 2016). Because this
redesign is young, majority of research looked at in this review are prior to the 2016
redesign.
There were 1,681,134 students in the class of 2016 who took the SAT, either the
old or redesigned version, at least once through June 2016 (“Class of 2016 SAT Results,”
10
2016). While the SAT is used in more institutions for admission and seems to be more
common, 2,090,342 students of the class of 2016 took the ACT (ACT, Inc., 2016).
The ACT is broken up into four sections: English, Math, Reading, and Science
(“Help and FAQ’s,” 2017). Students who take this test receive a composite score of 1-36,
which is made up of their average from the four test scores (“Help and FAQ’s,” 2017).
Along with a composite score, test takers receive four more scores designed to represent
college readiness: Science, Technology, Engineering, and Math (STEM) score, English
Language Arts (ELA) score, Progress Toward Career Readiness Indicator, and Text
Complexity Progress Indicator (“Help and FAQ’s,” 2017). The ACT test was designed to
measure academic achievement in the four sections, while the SAT focuses on reasoning
and definitions (“Help and FAQ’s,” 2017).
Standardized test scores predictability of first-year success. A significant amount
of research has suggested that SAT scores are valid and reliable predictors of first-year
GPA (FYGPA) in college (NACAC, 2016; Zwick, 2007b). An average correlation of
0.38 has been found between combined verbal and math SAT scores and FYGPA through
multiple research studies (Betts, 2011; Carlock, 2014; Zwick, 2007a). Zwick (2013)
suggests that 12-13% of the variance of first year GPA is attributed to SAT scores, and
21-22% of the variance is attributed to HSGPA and SAT scores combined.
The College Board conducted a validity test of the SAT in 2012 revealing a
stronger relationship between SAT scores and FYGPA with a correlation of .54 (Beard &
Marini, 2015). However, a stronger correlation of .61 was found when HSGPA was
added in (Beard & Marini, 2015). It is important to note that there may be bias in this
study, since The College Board, the organization responsible for the development and
11
distribution of the SAT, sponsored the research. Variance may be due to the
demographics of the sample; regions of the country sampled as well as undergraduate
enrollment were not equal (Beard & Marini, 2015). Variance may also be due to average
HSGPA of the sample as well as SAT scores (Beard & Marini, 2015). The mean HSGPA
was 3.62 with a standard deviation of 0.496 (Beard & Marini, 2015). The means of SAT
critical reading, SAT math, and SAT writing were 550, 571, and 544, respectively, with
standard deviations of 97.4, 99.7, and 99.5 (Beard & Marini, 2015).
Qualitative research has also suggested that there is predictability between
standardized test scores and academic success, but not all the time. However, the research
suggests the opposite of the quantitative criteria. Both admission officers and advisors
from Rowan University, based on their experience, believe that SAT scores do predict
academic success, however, they are only valid sometimes (Betts, 2011). These
administrators have often seen students with high SAT scores struggle in college and vice
versa (Betts, 2011). They recommended that SAT scores be given minimal weight when
making acceptance decisions (Betts, 2011).
Criticisms of the SAT. One criticism of standardized testing is how they are not
reliable for some students, i.e. students that come from a low-income family or a family
of low social economic status (SES) (Gilroy, 2007). Research has shown that there is a
positive correlation between family income and SAT scores: as family income increases,
so do SAT scores (Gilroy, 2007). Therefore, it is possible that socioeconomic status could
influence SAT and other standardized test scores (Gilroy, 2007).
It has also been noted that students with learning disabilities struggle with
standardized test taking; they are unable to successfully compete with other applicants
12
when comparing test scores (Betts, 2011).
Another criticism involves scholarship eligibility issues (Cohn, Cohn, Balch, &
Bradley, 2004; Gilroy, 2007). Research has suggested that nonwhite students are less
likely than their white counterparts to be eligible for scholarships if SAT scores are
required (Cohn et al., 2004). As for maintaining scholarships, “nonwhites are less likely
than whites, and males are less likely than females, to achieve the 3.0 GPA in college
required to maintain their scholarships” (Cohn et al., 2004, p. 585). Low socioeconomic
status may limit access to higher education due to standardized test bias (Gilroy, 2007).
SAT scores are more commonly becoming optional to submit during application because
of the likely bias against socioeconomic status (Betts, 2011; Cohn et al., 2004; Gilroy,
2007).
Even though research has suggested that the SAT is biased towards low SES
families and race/ethnicity, the College Board denies the bias (Letukas, 2015). Letukas
(2015) states how it is a fact that the positive correlation between higher SES status and
higher test scores is due to the rigorous course load in high school and not wealth.
Another fact discussed is that the SAT is not biased against some minority groups with
the reasoning being the rigorous pretest phase which determines which questions will be
used on the SAT (Letukas, 2015). If a question is biased during this phase to minority
groups, it will likely not be used in the final SAT (Letukas, 2015).
Another rumor discussed in the article addresses the problem of low predictability
of student achievement from SAT scores (Letukas, 2015). The fact discussed about this is
that the SAT is a “good predictor of first-year performance in college, student retention,
as well as cumulative college GPA” (Letukas, 2015, p. 3). It is then discussed that
13
HSGPA combined with SAT scores have an average correlation of .46 with first-year
college GPA, so both HSGPA and SAT scores should be used when assessing a student’s
application (Letukas, 2015). Much of the research disagrees with Letukas’ (2015) facts
(Cohn et al., 2004; Gilroy, 2007).
Uses of standardized testing in college admission. Past studies have looked at
admissions officers’ perspectives on the importance of SAT and ACT scores as
admission criteria. Gaitlin’s (1997) research indicated that both SAT and ACT scores
were second most important to admission officers and guidance counselors with HSGPA
being the most important. Admission officers averaged 4.67 on a five-point Likert-scale
for SAT scores, and 4.65 for ACT scores (Gaitlin, 1997). Guidance counselors averaged
4.48 on a five-point Likert-scale for SAT scores, and 4.05 for ACT scores (Gaitlin,
1997). Both subject groups agreed that standardized test scores were very important for
college admission. Getler (2007) surveyed admissions officers from four public
undergraduate institutions across New Jersey. It was discovered that 100% of subjects
responded that their institution believed standardized test scores were “most important”
or “very important” for admission (Getler, 2007).
Contrary to the research of the importance on SAT scores for college admission, a
study conducted by Betts (2011) suggested, through qualitative analysis, that assistant
directors of admissions at Rowan University believed SAT scores should hold minimum
weight when reviewing a potential student’s application. While some employees and
administrators believe that standardized test scores should hold minimum weight in an
applicant’s admission decision, research has shown that both admissions officers and
guidance counselors believe that they are the most important admission criteria (Gaitlin,
14
1997; Getler, 2007). The vast differences in the research calls for further research into the
usage of SAT scores in college admission.
High school GPA.
Predictability of high school GPA and first-year success. Quantitative research
has discovered an average correlation of 0.52 between HSGPA and FYGPA (Betts, 2011;
Carlock, 2014). This research suggests a stronger correlation between HSGPA and
FYGPA, yet institutions lean on SAT scores of potential students to make acceptance
decisions and identify their predicted success.
Use of high school GPA in college admission. Generally, HSGPA reflects the
strongest positive correlation with academic success and FYGPA in college (Betts, 2011;
Carlock, 2014; NACAC, 2016). Admission officers also look at grades throughout the
four years of high school, which includes growth and progress as well as course load
(Betts, 2011; McGinty, 2004).
Gaitlin’s (1997) study indicated that HSGPA was the most important admission
criteria to both admission officers and guidance counselors. Admission officers and
guidance counselors averaged 4.72 and 4.58 on a five-point Likert-scale, respectively
(Gaitlin, 1997). It was also discovered that guidance counselors believed HSGPA and
course selection better predicted college success, with SAT and ACT scores near the
bottom of the list (Betts, 2011).
Class rank. High school class rank has been defined as a “percentile rating of
academic placement in the high school graduating class,” (Nack & Townsend, 2007, p.
69). The student with the highest HSGPA is listed first, and the student with the lowest
HSGPA listed last (Nack & Townsend, 2007).
15
Class rank can be used to compare students from different schools and different
grading curves (NACAC, 2016). Using class rank as an admission criterion has become
increasingly less important over the past few years (NACAC, 2016). However, it is still
commonly used as a requirement for admission (NACAC, 2016).
There are many problems when using class rank to make an admission decision.
First, each year, fewer high schools are publicly sharing class rank (NACAC, 2016).
Because of this, many students’ class ranks can only be estimated, making the criterion
difficult to compare between applicants (NACAC, 2016).
Second, it has been found that high school class rank adds nothing to the
predictability of college success (Nack & Townsend, 2007). This is possibly due to how
class rank is established in each school district; it is almost impossible to compare a
student who has ranked first in their graduating class with a HSGPA of 3.23 and a student
who has ranked first with a 4.0 HSGPA (Nack & Townsend, 2007). Rank does not
represent an individual student’s HSGPA, but a student’s HSGPA compared to students
they graduated with (Nack & Townsend, 2007).
Gaitlin’s (1997) study indicated a significant difference between admission
officers and guidance counselors’ attitudes towards class rank. Admission officers
averaged 1.8 on a five-point Likert-scale, while guidance counselors averaged 4.11
(Gaitlin, 1997). This discrepancy calls for further research on the topic to make sure all
counselors are on the same page.
Qualitative Admission Criteria
Even though there is a general emphasis on academics and quantitative criteria for
college admission, many other criteria are used for admission decisions and required in

16
an admission application, In the literature, qualitative admission criteria are described as
personal qualities used to assess personal qualities and the character of an applicant
(Ishop, 2008). These criteria are used to get to know an applicant by more than just
numbers. Some of these criteria include extracurricular activities, personal essays, letters
of recommendation, interviews, District Factor Grouping (DFG), and course load and
transcripts.
Extracurricular activities. Extracurriculars are activities where participation
from students is outside of the classroom. These activities can be personal, community, or
school related. Extracurricular activities have been shown to have many benefits for
students, including development of social, academic, and intellectual skills (Lawhorn,
2008). Research suggests that involvement in extracurricular activities boosts students’
academic performances (Lawhorn, 2008). This leads to self-motivation, leadership, and
time management skills, as well as responsibility; all of these leading to higher grades
and HSGPAs (Lawhorn, 2008). Admission officers look for these qualities when
reviewing applications to predict retention, commitment, and leadership. Having
extracurricular activities on an application can help students stand out from other
applicants.
Predictability. Some research has suggested that participation in extracurricular
activities while in high school leads to a greater likelihood in high education enrollment
compared to joining the workforce or enlisting in the military (Martin, 2015). Data have
also suggested that the students with the highest test scores actively engage in
extracurricular activities (Kronholz, 2012). Benefits from participating in extracurricular

17
activities, such as higher grades, time management skills, and self-motivation, increases
the odds for students being admitted to college (Lawhorn, 2008; Martin, 2015).
However, results from the ATS survey suggested that few colleges found either no
correlation or small positive correlations between the relationship of extracurricular
activities to college academic achievement (NACAC, 2016). Findings are often
inconclusive or inconsistent when researching extracurriculars; some researchers believe
that there is only a low correlation between extracurriculars and academic success, while
others insist that there is a strong relationship (Kronholz, 2012).
Use in admissions. Extracurricular activities were seen as an indicator of time
management skills according to assistant directors of admissions at Rowan University
(Betts, 2011). As stated earlier, students who engage in extracurricular activities are more
likely to develop social, intellectual, and academic skills, all important characteristics that
admission officers look for in an applicant (Lawhorn, 2008; Martin, 2015).
Extracurricular activities may also show admission officers perseverance and
commitment, which, as some admission officers noted, may bump them from being on a
wait-list to being accepted (Richmond, 2011).
Personal essays. Personal essays, also referred to as college essays or admission
essays, are essays written by students from a prompt or question given by the institution.
Many schools require these as part of the application, while others list them as optional.
The undergraduate admissions process uses essays to evaluate writing ability and
characteristics (Ishop, 2008); these essays are comparable to personal statements used for
graduate admissions. The undergraduate admissions essays are writing samples that often
lead with a prompt and are generally about the applicant’s interests, personal goals, and
18
academic goals (Ishop, 2008). Admission officers use these essays as evidence of
creativity, intellect, and to assess writing skills (Ishop, 2008).
Ishop (2008) considered what students wrote in their college admission essays.
The analysis found that these students wrote essays with a focus on academic
opportunities, careers and jobs, travel, religion, moving, activities, family, coping with
adversity, and coping with illness and death (Ishop, 2008). Applicants wrote about these
topics and how they related to characteristics about themselves (Ishop, 2008). The essays
displayed personal qualities potential students wanted to show admission officers that
they felt would help them be accepted into the institution (Ishop, 2008).
However, there is a very small correlation between personal essays and school
performance, especially if prior grades are available (Murphy, Klieger, Borneman, &
Kuncel, 2009). Essays are not useful in predicting academic success, but can be used for
other purposes, including matching a student to an advisor or determining if the student
needs remedial programs (Murphy, Klieger, Borneman, & Kuncel, 2009).
Letters of recommendation. Letters of recommendation, in admission
applications, are written letters from an individual who can speak about the student from
personal experience. These letters are used to assess a student’s performance in school, at
work, or other outside activities through the perspective of someone else rather than
grades.
Research has indicated that there is a significant difference between the attitudes
towards recommendations between admission officers and guidance counselors (Gaitlin,
1997). Guidance counselors believed recommendations are given a higher weight than
19
admission officers, who give little weight to recommendations in practice (Gaitlin, 1997;
Getler, 2007).
Interviews. Interviews are occasionally conducted for applicants to get to know
them and how they hold themselves. There are two types of admission interviews that
may be conducted: informational or evaluative (“Admission Interview Tips,” n.d.).
Informational interviews are used to inform the potential student about the institution,
while evaluative interviews are used to assess the student, which then becomes a part of
the student’s application file (“Admission Interview Tips,” n.d.). While interviews seem
important and necessary to the admission process, only a handful of colleges require them
for undergraduate admissions. Interviews are seen more in graduate and doctoral settings,
especially medical schools, as well as for special admissions programs (Betts, 2011).
In a study on undergraduate admission interviews, admission officers focused on
motivation and oral communication to assess a student in an interview (Shahani,
Dipboye, & Gehrlein, 1991). Persistence in extra-curricular activities, academic
challenge, reading interests, interest in external affairs, overcoming handicaps and
hardships, overall confidence and energy, and an overall motivation were all used to
assess motivation (Shahani, Dipboye, & Gehrlein, 1991). Use of proper grammatical
structure, range of vocabulary, organization and coherence of discourse, intensity and
enthusiasm of discourse, and an overall oral communication rating were used to assess
oral communication (Shahani, Dipboye, & Gehrlein, 1991). In this study, low
correlations were found between a student’s paper credentials and interview evaluations,
suggesting that the interview found different information that was already given on paper
credentials (Shahani, Dipboye, & Gehrlein, 1991).
20
It is important to note that interviews are subjective and not always valid; an
interviewer may bring bias to the interview and give the interviewee lower scores based
on outside factors.
District Factor Grouping (DFG). When admission officers look at the
quantitative criteria of a student they take into consideration the high school and district
he or she attended (McGinty, 2004). New Jersey gives each district a District Factor
Grouping (DFG) score. These scores are used to measure a community’s approximate
socioeconomic status (SES) (“District Factor Groups (DFG) for School Districts,” 2000).
Six variables are used to develop each town’s score: percent of adults with no high school
diploma, percent of adults with some college education, occupational status,
unemployment rate, percent of individuals in poverty, and the median family income
(“District Factor Groups (DFG) for School Districts,” 2000). Communities can be ranked
from A-J, lowest to highest, respectively (“District Factor Groups (DFG) for School
Districts,” 2000).
Course load and transcript. Transcripts show the grades of students and their
course load over four years of high school. It also shows four years of growth, progress,
and perseverance (Betts, 2011; McGinty, 2004). Honors and Advanced Placement class
grades can provide insight on these characteristics and college readiness, as well.
Admission officers will look at course load as a factor of academic success both
in high school and possibly in college (McGinty, 2004). McGinty (2004) gives examples
of this, explaining how a “grade of B in Advanced Placement English is more important
than an A in chorus,” and “an A in chemistry carries more weight than an A in civics,”
(p. 6).
21
When interviewed, Rowan University admission officers said that they believed
high school transcript, including grades, course, and four-year performance, are a better
predictor of college success compared to SAT scores (Betts, 2011).
The Role of High School Guidance Counselors
Job description. NACAC’s Statement on Precollege Guidance and Counseling
and the Role of the School Counselor (1990) defines precollege guidance counseling as
activities that help students pursue challenging curriculum that results in more higher
education options, identify requirements for college access for students, and assist in
financial aid, college decisions, and other processes of the college application and
admission process.
The Counseling Trends Survey (CTS), administered by the NACAC in 2014,
collected information from high school guidance counselors about their work priorities
and responsibilities relating to the college admission and transition process (Clinedinst,
Koranteng, & Nicola, 2015). A total of 1,360 responses were collected (Clinedinst et al.,
2015). Two statements that the counselors responded to relating to the college admission
process were, “Advice and education for students and families on standardized testing,”
and “Actively represent students to college admission officers” (Clinedinst et al., 2015, p.
28). For the first statement, 30% answered frequently, 43% occasionally, 26%
infrequently, and 2% never (Clinedinst et al., 2015). For the second statement, 41%
responded frequently, 33% occasionally, 21% infrequently, and 5% never (Clinedinst et
al., 2015).
Role in the application process. Guidance counselors serve as the liaison
between high school and college. It is necessary for these counselors to not only
22
understand the admission process, but also the criteria that are most important for being
accepted into a higher education institution (Gaitlin, 1997; Ishop, 2008). Guidance
counselors are required to understand current admission requirements as part of their job
to help students with college applications and college selection and the application
process (NACAC, 2000). They are to help their students through the selection process by
identifying where he or she has the best chance of being successful (Trembly, 2013).
Guidance counselors’ main role is to “guide” their students through the college
application process.
Importance of understanding college admissions. Because guidance counselors
play such a large role in the college application process, it is key that they understand the
current practices of admissions (Gaitlin, 1997). Research consistently shows that high
school counseling is an area of concern, and addresses the need for improvement for
students to successfully be admitted into college (Richmond, 2011). Research also
suggests that communication between admission officers and guidance counselors needs
improvement so guidance counselors give the most accurate and up-to-date information
about college admissions to their students (Gaitlin, 1997; Ishop, 2008). Studies have
suggested that the two groups do not agree on what is most important in college
admissions. Many admission professionals report having negative experiences with
guidance counselors (Gaitlin, 1997; Richmond, 2011). It is likely that guidance
counselors are putting an emphasis on criteria that admission officers do not put much
consideration into when reviewing applications (Gaitlin, 1997). Ultimately, admission
officers are experts on what institutions are looking for in a student and this information
needs to properly be funneled to applicants (Ishop, 2008).
23
Demographic data have suggested that college admission officers are younger,
with less experience and less education than guidance counselors (Gaitlin, 1997). It is fair
to question whether this influences the admission process. Do guidance counselors differ
from admission officers in their attitudes towards the importance of admission criteria
because they have been in their field for a longer amount of time? Are they set in their
ways or is there a communication issue? It would be interesting to see if any of these
factors are related.
Summary of the Literature Review
The literature reveals that quantitative criteria seem to be favored over qualitative
requirements when it comes to predicting college academic success. These quantitative
criteria have extensive research that shows the connections between the numbers and
prediction of college success, which seems to be why they are favored in the admission
process.
Much more research was found on quantitative criteria than qualitative measures.
Only a handful of studies were found on qualitative criteria enrollment and predictability
of academic success.
Research continues to be contradictory on what are the best predictors of college
success, as well as what admission criteria are the most important (Betts, 2011; Carlock,
2014; Getler, 2007; Zwick, 2007a). There are only a handful of studies that look into both
admission officers and guidance counselors. The ones that do look into both groups find
that quantitative criteria are favored among importance for admission criteria, but are not
favored as far as predictability on academic success in college.
24
In order for students to be successful in their college application process and
college career, high school guidance counselors need to understand the current admission
process and what admission officers are looking for in a potential student.
There is a paucity of research in New Jersey that looks at admission criteria from
the perspective of admission officers and guidance counselors. My research also looks at
demographics and region a student is from as a criterion for admission. My research can
be used to help guidance counselors in New Jersey understand the essential criteria
needed to be accepted into the state’s institutions based on the attitudes of employees
from these institutions. Ultimately, this will help future students in New Jersey apply for
college by knowing exactly what admission officers are looking at in their application.

25
Chapter III
Methodology
Context of Study
This study was conducted at various public high schools and public four-year
institutions in New Jersey. All of the high schools and institutions chosen for this study
were located in New Jersey. Four-year colleges were chosen based on similarity; each of
the institutions were four-year public schools located in New Jersey with similar missions
and backgrounds.
The institutions included in this study were New Jersey City University, Kean
University, Montclair University, New Jersey Institute of Technology, Ramapo College
of New Jersey, Rowan University, Stockton University, The College of New Jersey, and
William Patterson University. Table 3.1 describes each institution contacted for this study
including number of admission counselors for each institution.
Table 3.1
!
Institutions Used for Data Collection
Institution
Number of Admission Counselors*
New Jersey City University
22
Kean University
8
Montclair University
13
New Jersey Institute of Technology
8
Ramapo College of New Jersey
8
Rowan University
11
Stockton University
9
The College of New Jersey
9
William Patterson University
10
Note. *Counselors include those with the title of counselor and higher

26
High schools were chosen randomly by District Factor Grouping (DFG). As
described in Chapter II, DFG is a score used to measure approximate socioeconomic
status (SES) of a community (“District Factor Groups (DFG) for School Districts,”
2000). The scores range from A to J, lowest to highest, respectively (“District Factor
Groups (DFG) for School Districts,” 2000). Communities who are scored A rank as a low
SES community, while communities who are scored J rank as a high SES community.
Districts were sorted into three groups: A-C, D-F, and G-I. After being sorted, 25% of
each group was selected using a random number generator. Forty-five districts were
chosen for both the A-C and D-F group, and 52 districts were chosen for the G-I group. A
contact list of guidance counselors and admission officers was compiled through high
school and institutional websites. Emails addresses for data collection were found
through these websites.
Table 3.2 describes the districts with DFG scores from A-C. The table describes
each district including the DFG scores, the high school that students attend, and how
many guidance counselors the school has.
Table 3.2
School Districts Used for Data Collection with A-C DFG Rating
District
Attending High School
DFG*
Number of
Guidance
Counselors
City of Orange Twp
Orange High School
A
3
Elsinboro Twp
Salem High School
A
4
Fairview Boro
Cliffside High School
A
5
Millville City
Memorial High School &
Millville High School
A
6
Mine Hill Twp
Dover High School
A
5

27
Table 3.2 (continued)
District
Attending High School
DFG*
Number of
Guidance
Counselors
Penns Grove Carneys Point
Penn Grove High School
A
4
Quinton Twp
Salem High School
A
4
Trenton
Trenton High School Main
Campus & Trenton High School
West Campus
A
10
Vineland City
Vineland High School
A
8
Washington Township
(Burlington County)
Cedar Creek High School
A
5
West New York
Memorial High School
A
6
Wildwood City
Wildwood High School
A
2
Woodbine Boro
Middle Township High School
A
3
Bellmawr Boro
Trinton High School
B
8
Berkeley Twp
Central Regional High School
B
6
Beverly City
Palmyra High School
B
2
Carteret Boro
Carteret High School
B
4
Cumberland Regional
Cumberland Regional High
School
B
5
Deerfield Twp
Cumberland Regional High
School
B
5
Glassboro
Glassboro High School
B
3
Gloucester City
Gloucester City Junior-Senior
High School
B
4
Greenwich (Warren)
Phillipsburg High School
B
5
Island Heights
Central Regional High School
B
6
Passaic County Manchester
Manchester Regional High
School
B
4
Riverton
Palmyra High School
B
2
Waterford Twp
Hammonton High School
B
5
Weymouth Twp
Buena Regional High School
B
3
Barnegat Twp
Barnegat High School
CD
5
Bayonne City
Bayonne High School
CD
11
Carlstadt-East Rutherford
Henry P. Becton Regional High
School
CD
2
Clayton Boro
Clayton High School
CD
3

28
Table 3.2 (continued)
District
Attending High School
DFG*
Number of
Guidance
Counselors
Clifton City
Clifton High School
CD
12
Elmwood Park
Elmwood Park Memorial High
School
CD
2
Gateway Regional
Gateway Regional High School
CD
5
Greater Egg Harbor
Absegami High School, Cedar
Creek High School, & Oakcrest
High School
CD
15
Hackensack City
Hackensack High School
CD
7
Keyport Boro
Keyport High School
CD
3
Manville Boro
Manville High School
CD
2
Merchantville
Pennsauken High School
CD
5
Monroe Twp (Gloucester)
Williamstown High School
CD
8
Pemberton Borough
Pemberton Township High
School
CD
6
Pennsville
Pennsville High School
CD
3
South Hackensack Twp
Hackensack High School
CD
7
Union Beach
Keyport High School
CD
3
Weehawken Twp
Weehawken High School
CD
3
Wenonah Boro
Gateway Regional High School
CD
5
Woodbury Heights
Gateway Regional High School
CD
5
Note. *DFG rating is based off of 2000 Decennial Census
Table 3.3 describes the school districts with DFG scores from D-F. The table
describes each school district including the DFG scores, the high school that students
attend, and how many guidance counselors the school has.

29
Table 3.3
School Districts Used for Data Collection with D-F DFG Rating
District
Attending High School
DFG*
Number of
Guidance
Counselors
Allamuchy
Hackettstown High School
DE
3
Belvidere Town
Belvidere High School
DE
2
Butler Boro
Butler High School
DE
3
Eastampton Twp
Rancocas Valley Regional High
School
DE
8
Frankford Twp
High Point Regional High
School
DE
5
Franklin Twp
Franklin High School
DE
8
Gloucester Twp
Black Horse Pike Regional
High School
DE
11
Hardyston Twp
Wallkill Valley HS
DE
3
Harmony Twp
Belvidere High School
DE
2
Lakehurst Boro
Jackson Liberty High School
DE
8
Longport
Ocean City High School
DE
5
Montague Twp
High Point Regional High
School
DE
5
Mount Ephraim Boro
Audubon High School
DE
3
North Arlington Boro
North Arlington High School
DE
2
North Plainfield Boro
North Plainfield High School
DE
4
Ocean City (Cape May)
Ocean City High School
DE
5
Ridgefield Park Twp
Ridgefield Park Jr./Sr. High
School
DE
4
Sayreville Boro
Sayreville War Memorial High
School
DE
7
Sea Isle City
Ocean City High School
DE
5
Sterling
Sterling High School
DE
5
Toms River Regional
High School East, High School
North, & High School South
DE
17
West Deptford Twp
West Deptford High School
DE
5
Westampton
Rancocas Valley Regional High
School
DE
8
Bergenfield
Bergenfield High School
FG
5

30
Table 3.3 (continued)
District
Attending High School
DFG*
Number of
Guidance
Counselors
Bordentown Regional
Bordentown Regional High
School
FG
3
Cinnaminson Twp
Cinnaminson High School
FG
4
Hoboken City
Hoboken High School
FG
3
Hopatcong
Hopatcong High School
FG
4
Little Falls Twp
Passaic Valley Regional High
School
FG
6
Mantoloking
Point Pleasant Beach High
School
FG
2
Middlesex Boro
Middlesex High School
FG
3
Ocean Twp (Monmouth)
Ocean Township High School
FG
5
Ocean Twp (Ocean)
Southern Regional High School
FG
9
Old Bridge Twp
Old Bridge High School
FG
12
Pompton Lakes Boro
Pompton Lakes High School
FG
4
Sea Bright Boro
Shore Regional High School
FG
3
South Plainfield Boro
South Plainfield High School
FG
4
Totowa Boro
Passaic Valley Regional High
School
FG
6
Warren Hills
Warren Hills Regional High
School
FG
5
Washington Twp
(Gloucester)
Washington Township High
School
FG
11
West Amwell Twp
South Hunterdon Regional High
School
FG
2
Woodstown-Pilesgrove
Regional
Woodstown High School
FG
4
Note. *DFG rating is based off of 2000 Decennial Census
Table 3.4 describes the districts with DFG scores from G-I. The table describes
each district including the DFG scores, the high school that students attend, and how
many guidance counselors the school has.

31
Table 3.4
School Districts Used for Data Collection with G-I DFG Rating
District
Attending High School
DFG*
Number of
Guidance
Counselors
Barrington Boro
Haddon Heights High School
GH
4
Delaware Valley Regional
Delaware Valley Regional High
School
GH
5
Emerson Boro
Emerson Junior-Senior High
School
GH
2
Freehold Twp
Freehold Township High
School
GH
9
Frenchtown Boro
Delaware Valley Regional High
School
GH
5
Hanover Park
Hanover Park High School
GH
4
Hanover Twp
Whippany Park High School
GH
4
Harrison Twp
Clearview Regional High
School District
GH
6
Kingwood Twp
Delaware Valley Regional High
School
GH
5
Lawrence Twp
Lawrence High School
GH
4
Leonia Boro
Leonia High School
GH
3
Manasquan Boro
Manasquan High School
GH
5
Medford Twp
Shawnee High School
GH
7
Milford Boro
Delaware Valley Regional High
School
GH
5
Millstone
Allentown High School
GH
5
Monmouth Regional
Monmouth Regional High
School District
GH
5
Netcong
Lenape Valley Regional High
School
GH
4
Piscataway Twp
Piscataway High School
GH
11
Roosevelt Boro
East Windsor Regional High
School
GH
2
Rutherford Boro
Rutherford High School
GH
4
South Belmar
Manasquan High School
GH
5
Spring Lake Heights Boro
Manasquan High School
GH
5

32
Table 3.4 (continued)
District
Attending High School
DFG*
Number of
Guidance
Counselors
Voorhees Twp
Eastern Regional High School
GH
9
Alpine Boro
Tenafly High School
I
7
Bedminster Twp
Bernards High School
I
4
East Amwell Twp
Hunterdon Central High School
I
16
Essex Fells Boro
West Essex Regional High
School
I
6
Franklin Lakes Boro
Ramapo High School & Indian
Hills High School
I
12
Glen Ridge Boro
Glen Ridge High School
I
3
Hampton Boro
Voorhees High School
I
6
Harding Township
Madison High School
I
4
Hillsborough Twp
Hillsborough High School
I
11
Hillsdale Boro
Pascack Valley High School
I
6
Lebanon Twp
North Hunterdon High School
I
8
Long Hill Twp
Watchung Hills Regional High
School
I
10
North Caldwell Boro
West Essex Regional High
School
I
6
Northern Valley Regional
Northern Valley Demarest &
Northern Valley Old Tappan
I
13
Oakland Boro
Ramapo High School & Indian
Hills High School
I
12
Pascack Valley Regional
Pascack Hills High School &
Pascack Valley High School
I
10
Readington Twp
Hunterdon Central High School
I
16
Roseland Boro
West Essex Regional High
School
I
6
South Brunswick Twp
South Brunswick High School
I
10
Summit City
Summit High School
I
8
Union Twp
North Hunterdon High School
I
8
Verona Boro
Verona High School
I
4
Washington Twp (Morris)
West Morris Central High
School
I
6

33
Table 3.4 (continued)
District
Attending High School
DFG*
Number of
Guidance
Counselors
West Essex Regional
West Essex Regional High
School
I
6
Bernards Twp
Ridge High School
J
9
Boonton Town
Mountain Lakes High School
J
6
Haddonfield Boro
Haddonfield Memorial High
School
J
5
Rumson Boro
Rumson-Fair Haven Regional
High School
J
5
Upper Saddle River Boro
Northern Highlands Regional
High School
J
6
Note. *DFG rating is based off of 2000 Decennial Census
Since the study focused on undergraduate admissions, community colleges were
not included for this study because they generally have an open enrollment admissions
practice. Medical schools were also not included since they award professional degrees.
Lastly, only public high schools and institutions were studied since they are funded by
the New Jersey government, and are similar in nature.
Population and Sampling
The target population of this study was all high school guidance counselors and
admission officers located in New Jersey. The sample for the study was a combination of
a convenience sample, purposive sample, and random sampling of the high school
guidance counselors from selected high schools in New Jersey, as well as admissions
officers working for selected four-year institutions.
There are approximately 1,200 members of the NJACAC, the New Jersey
Association for College Admission Counseling, which includes both guidance counselors
34
and admission professionals all from schools in New Jersey (“About NJACAC,” 2017).
A sample size calculator was used to get the sample size, with a confidence level of 95%
and 3% error rate. After reviewing public school websites and their guidance department
webpages, approximately 600 guidance counselors were employed in 142 school
districts, which only represents about 25% of public school districts in New Jersey. Thus,
the sample size was 698, including 600 guidance counselors and 98 admissions
counselors from the selected public four-year institutions. The desired sample size was
489 subjects, and would be made up of 420 guidance counselors, and 69 admission
counselors, 70% of the sample, respectively. The more realistic sample size would be
made up of 300 guidance counselors and 49 admissions counselors, 50% of the sample,
respectively. More guidance counselors were included in data collection and since more
public-school districts were included in the study compared to public four-year
institutions: this represents the New Jersey education system with more public-school
districts than public four-year institutions.
Both guidance counselors and admission officers were recruited through email.
Email addresses were compiled through high school and institutional websites available
publicly. The professionals were emailed an initial email on January 2
nd
, 2018 (Appendix
B), followed by reminder emails (Appendix C) every week to those who have not
responded to the survey; this is a feature on Qualtrics and the principal investigator and
co-investigator did not know who had and had not answered.
Data Collection Instruments
Two separate surveys were developed; one to distribute to admission officers of
the selected institutions (Appendix E) and one to distribute to guidance counselors of the
35
selected institutions (Appendix F). The surveys were developed through knowledge of
the database, mainly looking at Getler’s (2007) instruments for guidance
recommendation. Drafts of the survey were distributed to guidance counselors and
admission officers to test validity and reliability, as well as higher education
professionals. The professionals looked at the drafts and gave feedback on content,
grammar, and comprehension to establish face validity. A Cronbach Alpha was
calculated through SPSS after data collection was complete to determine the reliability of
the Likert-scale portion of the survey. After running the Cronbach Alpha test for the
Likert-scale section, the Alpha coefficient was .0588. This is a low internal reliability,
making the survey only slightly reliable; however, this is likely due to a small sample size
and a low number of items on the survey.
Two different surveys were distributed, one with wording suited towards
admission officers (Appendix E), and the other with wording relevant towards guidance
counselors (Appendix F). The survey used consisted of three sections: demographics,
Likert-scale items, and open-ended questions. The first section asked about the subjects’
background, including educational and employment background. The second section
used a Likert-scale format designed to probe subjects to choose 1-5, not important to
most important, on their opinion of how important each of the selected admission criteria
are for a high school senior to be accepted into a four-year institution.
The last section was two open-ended questions, the first question asking subjects
to list their opinion on the two most important criteria. The second open-ended question
asked to see if there were any differences between the opinion on the most important
admission criteria and which one best predicts academic success based on contradictions
36
of previous research. Both open-ended questions had drop down menus on Qualtrics to
make data analysis easier. Guidance counselors and admission officers answered the
open-ended questions by choosing their answer from a given list.
Alternate consent was used for subjects. Since it was not possible to receive
signatures from each subject, the individuals who voluntarily complete the survey
consented to an alternative consent (Appendix D), located before the survey began.
Data Collection Procedures
Before any data were collected, the Institutional Review Board application was
completed and approved. Following approval on November 27
th
, 2017 from Rowan
University’s Institutional Review board (Appendix A), data collection began.
A convenience sample was used to select public high schools used in the study.
Since District Factor Grouping (DFG) was a variable in the study, all public-school
districts in New Jersey were sorted into three groups: A-C, D-F, and G-I. After being
sorted, 25% of each group was selected using a random number generator. Forty-five
districts were chosen for both the A-C and D-F group, and 52 districts were chosen for
the G-I group. Four-year colleges were chosen based on similarity; each of the
institutions are four-year public schools located in New Jersey with similar missions. A
contact list of guidance counselors and admission officers was compiled through high
school and institutional websites. Emails addresses for data collection was found through
these websites.
The survey items were formatted and designed using Qualtrics, an online survey
development program, which collects and organizes data and results. The surveys were
distributed via email to the selected admission officers and guidance counselors from the
37
participating schools. The emails included an explanation of the study, as well as a link to
complete the survey (Appendix B; Appendix C). The email addresses of the subjects
were found on both institutional websites and school district websites.
Data Analysis
Data analysis was conducted using the Statistical Package for the Social Sciences
(SPSS) software and Microsoft Excel. Data from incomplete surveys were not used; only
finished surveys were included in data analysis. Incomplete surveys were defined as
surveys that were less than 50% complete, meaning the subjects had to complete at least
nine questions. Seventeen surveys were removed from data analysis due to incompletion.
After data collection was complete, all data were exported from Qualtrics into SPSS for
analysis, and all identifying information were removed once exported. The data were then
analyzed using descriptive statistics, including frequencies, percentages, means, and
standard deviations. Independent samples t-tests were also used to look for significant
similarities and differences between the means of the two subject groups. Since the open-
ended section of the survey had drop downs of specific choices for subjects to select, data
were analyzed by numbering each of the possible responses, and looking at frequencies
and percentages of each chosen response.
38
Chapter IV
Findings
Profile of the Samples: Guidance Counselors and Admission Officers
This quantitative study looked at two different groups: high school guidance
counselors and admission counselors. The guidance counselors were employed at public
high schools across the state of New Jersey. The admission officers were employed in
public four-year institutions with titles ranging from Admission Officer to Director of
Admissions.
Table 4.1 contains demographic information on the guidance counselors
surveyed, including gender, education level, and questions about their length of
employment. These demographics may suggest the varying knowledge level of college
admission based on their employment and education. Surveys were emailed to 648
guidance counselors who worked in approximately 142 public school districts throughout
New Jersey. After distributing the survey to the guidance counselors, 35 emails failed, 10
bounced back, and five emails were duplicate. Throughout the data collection process,
some subjects emailed to let me know they did not fit in to the sample profile; 12
guidance counselors were removed from the sample size. Incomplete surveys were
defined as surveys which had less than 50% of questions answered. There were 15
surveys also removed from the sample size and analysis due to being incomplete. A total
of 232 responses were collected for a response rate of 41%.

39
Table 4.1
Demographics of Guidance Counselors (N=232)
Subjects
f
%
Sex*
Male
60
25.9
Female
171
73.7
Other
0
0
Age
Under 30
20
8.6
30-39
72
31
40-49
73
31.5
50+
67
28.9
Education
High School/GED
0
0
Some college
0
0
Bachelor's Degree
0
0
Master's Degree
225
97
Doctoral Degree
7
3
Years Worked at Current School/District
Less than 5
56
24.1
5-10
54
23.3
11-15
52
22.4
Over 15
70
30.2
Years in Current Position
Less than one
12
5.2
1-3
38
16.4
4-5
19
8.2
Over 5
163
70.3
Note. *Missing=1
Table 4.2 contains demographic information on the admission officers surveyed,
including the same demographic information from the guidance counselor survey. These
demographics may suggest the varying knowledge levels of college admission subjects
based on their length of employment and years in their current position. A total of 98
admission officers email addresses were collected from nine institutions. All emails to

40
admission officers went through. All employees who received the email had the title of
Admission Officer or higher. Throughout the data collection process, some subjects
emailed to let me know they did not fit in to the sample profile; three admission officers
were removed from the sample size. Incomplete surveys were defined as surveys which
had less than 50% of questions answered. There were two surveys also removed from the
sample size and analysis due to being incomplete. A total of 47 responses were recorded
for a response rate of 51%.
Table 4.2
!
!
!
Demographics of Admission Officers (N=47)
Subjects
f
%
Sex
!
!
!
Male
!
20
42.6
Female
!
26
55.3
Other
!
1
2.1
!
!
!
!
Age
!
!
!
Under 30
!
18
38.3
30-39
!
14
29.8
40-49
!
8
17
50+
!
7
14.9
!
!
!
!
Education
!
!
!
High School/GED
0
0
Some college
!
1
2.1
Bachelor's Degree
16
34
Master's Degree
27
57.4
Doctoral Degree
3
6.4
!
!
!
!
Years Worked at Current School/District
Less than 5
!
26
55.3
5-10
!
3
6.4
11-15
!
9
19.1
Over 15
!
9
19.1
!
!
!
!
!
!
!
!

41
Table 4.2 (continued)
!
!
Subjects
f"
%"
Years in Current Position
!
!
Less than one
10
21.3
1-3
!
18
38.3
4-5
!
6
12.8
Over 5
!
13
27.7
Analysis of the Data
Research question 1. What are the most important admission criteria according
to selected admission officers and guidance counselors in New Jersey?
Table 4.3 depicts the guidance counselors’ attitudes towards the importance of the
admission criteria selected for this study. Items are arranged from most to least important
using mean scores. Results indicate that guidance counselors rated the most important
criteria (62.9%) was course load and transcript, while the least important criteria (35%)
was District Factor Grouping.
The three most important criteria to guidance counselors were course load and
transcript, HSGPA, and SAT and ACT scores with means of 4.57, 4.45, and 3.87,
respectively. For both course load and transcript and HSGPA, guidance counselors
mainly responded with “Very Important” and “Most Important” with more choosing
“Most Important.” Guidance counselors predominately answered with “Less Important”
or “Important” when responding to SAT and ACT scores with more indicating
“Important.”
The three least important criteria to guidance counselors were interviews, letters
of recommendation, and DFG. The means of these three criteria were 3.2, 3.09, and 2.57,
respectively. For both interviews and letters of recommendation, guidance counselors

42
mainly responded with “Important” or “Very Important” with more responding
“Important.” Guidance counselors predominately answered with “Less Important” and
“Important” when responding to DFG with more indicating “Important.” It is important
to note that 10 guidance counselors did not respond to the question asking about DFG.
This may be due to lack of knowledge behind what the DFG is. This also may have
influenced their attitude towards importance.
Table 4.3
Guidance Counselors' Attitudes Towards Admission Criteria (N=232)
(1=Not Important, 2=Less Important, 3= Important, 4=Very Important, 5=Most
Important)
Criteria
Not
Important
Less
Important
Not
Important
Very
Important
Most
Important
f
%
f
%
f
%
f
%
f
%
Course Load and
Transcript
1
0.4
1
0.4
9
3.9
74
31.9
146
62.9
M=4.57 SD=.634
Missing=1
High School GPA
2
0.9
12
5.2
97
41.8
121
52.2
M=4.45 SD=.636
SAT/ACT Scores
10
4.3
55
23.7
120
51.7
46
19.8
M=3.87 SD=.773
Missing=1
Personal Essay
3
1.3
15
6.5
85
36.6
100
43.1
29
12.5
M=3.59 SD=.838
Extra-curricular activities
18
7.8
87
37.5
109
47
17
7.3
M=3.54 SD=.744
Missing=1
High School Class Rank
15
6.5
44
19
47
20.3
96
41.4
29
12.5
M=3.35 SD=1.12
Missing=1

43
Table 4.3 (continued)
Criteria
Not
Important
Less
Important
Not
Important
Very
Important
Most
Important
f
%
f
%
f
%
f
%
f
%
Interview
10
4.3
51
22
78
33.6
66
28.4
25
10.8
M=3.2 SD=1.041
Missing=2
Letters of
Recommendation
9
3.9
49
21.1
99
42.7
62
26.7
13
5.6
M=3.09 SD=.924
District Factor Grouping
35
15.1
62
26.7
93
40.1
28
12.1
4
1.7
M=2.57 SD=.962
Missing=10
Table 4.4 depicts the admission officers’ attitudes towards the importance of the
admission criteria selected for this study. Items are arranged from most to least important
using mean scores. The results indicate HSGPA is the most important (68.1%) to
admission officers, while the least important (34%) was District Factor Grouping.
The three most important criteria to admission officers are HSGPA, Course load
and transcript, and SAT and ACT scores. HSGPA and course load and transcript had
means of 4.6 and 4.23, respectively, indicating that the admission professionals mainly
responded with “Very Important” or “Most Important,” with more answering “Most
Important.” SAT and ACT scores had a mean of 3.36, indicating that admission officers
mainly responded with “Important” or “Very Important” with more answering with
“Important.”
The three least important criteria to admission officers are letters of
recommendation, interviews, and DFG. The means of these three criteria were 2.89, 2.55,
and 2.02, respectively. For both letters of recommendation and interviews, admission

44
officers responded mainly with “Less Important” or “Important” with more responding
with “Important.” Admission officers predominately answered with “Not Important” or
“Less Important” when responding to DFG with an even number, sixteen, indicating each
of these responses.
Table 4.4
Admission Officers' Attitudes Towards Admission Criteria (N=47)
(1=Not Important, 2=Less Important, 3= Important, 4=Very Important, 5=Most
Important)
Criteria
Not
Important
Less
Important
Not
Important
Very
Important
Most
Important
f
%
f
%
f
%
f
%
f
%
High School GPA
1
2.1
1
2.1
13
27.7
32
68.1
M=4.6 SD=.742
Course Load and
Transcript
1
2.1
1
2.1
7
14.9
15
31.9
23
48.9
M=4.23 SD=.937
SAT/ACT Scores
4
8.5
2
4.3
19
40.4
17
36.2
5
10.6
M=3.36 SD=1.031
Extra-curricular activities
2
4.3
7
14.9
21
44.7
13
27.7
4
8.5
M=3.21 SD=.954
Personal Essay
2
4.3
13
27.7
20
42.6
9
19.1
3
6.4
M=2.96 SD=.955
High School Class Rank
6
12.8
12
25.5
13
27.7
9
19.1
6
12.8
M=2.93 SD=1.237
Missing=1
Letters of
Recommendation
1
2.1
17
36.2
19
40.4
6
12.8
4
8.5
M=2.89 SD=.961
Interview
12
25.5
11
23.4
13
27.7
8
17
3
6.4
M=2.55 SD=1.23

45
Table 4.4 (continued)
Criteria
Not
Important
Less
Important
Not
Important
Very
Important
Most
Important
f
%
f
%
f
%
f
%
f
%
District Factor Grouping
16
34
16
34
12
25.5
1
2.1
1
2.1
M=2.02 SD=.954
Missing=1
Research question 2. What similarities or differences are found between these
two groups and their attitudes towards current college requirements?
Table 4.5 depicts the means and standard deviations of the importance of
admission criteria between guidance counselors and admission officers. An independent-
samples t-test was used to compare the mean scores of importance of each of the
admission criteria between guidance counselors and admission officers. Significant
differences of means were found between the subject groups and their response towards
SAT and ACT scores, high school class rank, extra-curricular activities, personal essays,
interviews, DFG, and course load and transcript; no significance was found in the means
of HSGPA and letters of recommendation. The means of guidance counselors were
significantly higher than admission officers for all significant comparisons.

46
Table 4.5
Importance of Admission Criteria Means for Guidance Counselors and Admission
Officers
Position
Guidance
Counselors
Admission
Officers
t
df
SAT/ACT Scores
3.87
3.36
3.9**
276
(.773)
(1.03)
High School Class
Rank
3.35
2.93
2.24*
275
(1.12)
(1.24)
Extra-curricular
Activities
3.54
3.21
2.62**
276
(.744)
(.954)
Personal Essays
3.59
2.96
4.61**
277
(.838)
(.955)
Interviews
3.2
2.55
3.73**
275
(1.04)
(1.23)
DFG
2.57
2.02
3.51**
266
(.962)
(.954)
Course Load and
Transcript
4.57
4.23
3.04**
276
(.634)
(.937)
Note. *p<.05, **p<.01, Standard Deviations appear in parentheses below means.
Research question 3. Do the subjects’ attitudes towards the chosen admission
criteria correlate to the literature on the predictability of student academic success?
Table 4.6 shows the frequencies and percentages to the answer of the question
“Have you read any past or current research relating to SAT scores and predictability of
academic success?” Majority of the guidance counselors and admission officers have
read some literature relating to SAT scores and the predictability of student academic
success.

47
Table 4.6
Read Any Past/Current SAT Research (N=279)
Response
Position
Guidance Counselors
Admission Officers
Yes
193 (83.2%)
31 (66%)
No
29 (12.5%)
14 (29.8%)
Unsure
10 (4.3%)
2 (4.3%)
Table 4.7 shows the frequencies and percentages of both subject groups answer to
the question “Out of the criteria listed, which one criterion best predicts academic
success?” Guidance counselors indicated that course load and transcript best predict
academic success (54.3%), while admission officers indicated that HSGPA best predicts
academic success (44.7%).
Table 4.7
Belief of Which Criterion Predicts Academic Success (N=279)
Admission Criteria
Position
Guidance Counselors*
Admission Officers**
SAT/ACT Scores
10 (4.3%)
4 (8.5%)
High School GPA
76 (32.8%)
21 (44.7%)
High School Class Rank
4 (1.7%)
0 (0%)
Extra-curricular Activities
1 (0.4%)
0 (0%)
Personal Essay
3 (1.3%
1 (2.1%)
Letters of Recommendation
1 (0.4%)
0 (0%)
Interviews
0 (0%)
1 (2.1%)
District Factor Grouping
0 (0%)
0 (0%)
Course load and Transcript
126 (54.3%)
17 (36.2%)
Note. *Missing= 11, **Missing=3

48
Chapter V
Summary, Discussion, Conclusions, and Recommendations
Summary of the Study
This thesis set out to investigate the attitudes of importance towards specific
admission criteria from admission officers and guidance counselors located throughout
New Jersey. The admission criteria used were defined as both quantitative and
qualitative: SAT and ACT scores, HSGPA, high school class rank, extra-curricular
activities, personal essays, letters of recommendation, interviews, DFG, and course load
and transcript. Guidance counselors from approximately 142 public school districts were
emailed surveys, as well as admission officers from nine public four-year institutions in
New Jersey. All subjects were surveyed during the spring 2018 semester.
Two separate surveys were developed; one to distribute to admission officers of
the selected institutions (Appendix E) and one to distribute to guidance counselors of the
selected institutions (Appendix F). The surveys were formatted and collected using the
Qualtrics software on demographics, importance of nine number of different admissions
criteria using a Likert-scale, the subjects’ opinions on the two most important criteria,
and the criterion they believe best predicts academic success. After data collection was
complete, SPSS was used to analyze the data for frequencies, percentages, and means. A
total of 232 guidance counselors and 47 admission officers responded to the survey,
yielding response rates of 41% and 51%, respectively.
Discussion of the Findings
Research question 1. What are the most important admission criteria according
to selected admission officers and guidance counselors in New Jersey?

49
Both guidance counselors and admission officers responded with SAT and ACT
scores, course load and transcript, and high school GPA as being the three most important
admission criteria for a high school senior to be accepted into a four-year institution.
While the two subject groups agreed generally on the three most important criteria,
guidance counselors reported that each of these criteria, individually, were more
important than what admission officers indicated. Because of this difference, it can be
concluded that there is a disconnect between guidance counselors and admission officers
on what are the most important admission criteria and how important these criteria are for
high school students in the application and admission process.
NACAC’S Admission Trends Survey from fall 2015, determined that the criteria
used most in admission decisions were HSGPA, standardized test score, and strength of
curriculum, all of which admissions officers and guidance counselors indicated are most
important (NACAC, 2016). Even though there is a disconnect on the level of importance
between the two subject groups, they both indicated the same most important criteria that
align with the Admission Trends Survey.
This disconnect between guidance counselors and admission officers can
negatively affect a student’s college application process. Research suggests that there
needs to be strong communication between admission officers and guidance counselors
so guidance counselors can give their students the most up-to-date information to their
students about college admissions (Gaitlin, 1997; Ishop, 2008). The results of this study
indicate that guidance counselors lack knowledge of the current practices of college
admissions, which is a key component of their job, and continues to be an area of concern
(Gaitlin, 1997; NACAC, 2000; Richmond, 2011).

50
Research question 2. What similarities or differences are found between these
two groups and their attitudes towards current college requirements?
When first looking at the data collected, it seemed as if both guidance counselors
and admission officers responded similarly when asked about the importance of each
admission criteria. However, after closer analysis, the two subject groups varied
significantly.
As previously discussed, guidance counselors and admission officers generally
responded with the same criteria for what criteria were most important. Conversely, the
three least important criteria to both subject groups were DFG, interviews, and letters of
recommendation. Similar to the most important criteria, guidance counselors responded
with higher importance to each of the least important criteria than admission officers.
Because of this difference again, it can be concluded that there is a disconnect between
guidance counselors and admission officers on what are the least important admission
criteria and how little importance these criteria have for high school students in the
application and admission process. What varied was how important these criteria were
for high school students. Guidance counselors generally responded higher on the Likert-
scale, meaning they believed the criteria were more important than admission officers.
DFG, interviews, and letters of recommendation were all defined as qualitative
criteria in this thesis. The literature discussed in Chapter II revealed that quantitative
criteria seemed to be favorited over qualitative requirements. The previous findings
suggested that quantitative criteria were most important to being accepted into college,
which is consistent with these subjects believing that qualitative criteria are not as
important (Getler, 2007; NACAC, 2016). Usually, qualitative criteria, like course load

51
and transcript, are not taken into consideration as strongly as quantitative criteria, like
SAT and ACT and HSGPA, when admissions offices review an application; they are
normally given more consideration when the application is reviewed holistically, taking
both quantitative and qualitative criteria from the applicant into consideration (Carlock,
2014; Gilroy, 2007; Hornberger, 2010; Richmond, 2011). However, both subject groups
indicated a strong importance for course load and transcript.
Research question 3. Do the subjects’ attitudes towards the chosen admission
criteria correlate to the literature on the predictability of student academic success?
As Chapter II discussed, there is an abundance of literature on the predictability of
admission criteria used in this study, mainly relating to SAT and ACT scores (Betts,
2011; Carlock, 2014; Zwick, 2007a). Chapter II also noted that the research continues to
differ on what are the best predictors of college success (Betts, 2011; Carlock, 2014;
Getler, 2007; Zwick, 2007a). Therefore, I made sure to ask subjects if they have read any
research, specifically on the SAT, since standardized test scores are so prominent in
admissions, but lack predictability of academic success once a student is in college.
The results found that 83.2% of guidance counselors and 66% of admission
officers have read past or current research relating to SAT scores and predictability of
academic success SAT research. When asked what criterion best predicts academic
success, guidance counselors chose course load and transcript (54.3%), and admission
officers chose HSGPA (44.7%). The literature reveals that the strength of curriculum may
be best at predicting academic success (Betts, 2011; NACAC, 2016). It is possible that
reading past or current research on the predictability of SAT scores could have possibly
influenced the subjects’ decisions on what criterion best predicts academic success.
52
When asked which criterion best predicts academic success, SAT and ACT scores
were not chosen as much as GPA and course load and transcript. These results are
consistent with findings on predictability of academic success; HSGPA and course load
and transcript are more likely to determine academic success through a student’s FYGPA
compared to standardized test scores, like the SAT and ACT (Betts, 2011; Carlock, 2014;
McGinty, 2004).
Conclusions
Data from this study suggest that the three most important criteria for students to
be accepted into a higher education institution are SAT and ACT scores, HSGPA, and
course load and transcript; analysis suggests that guidance counselors and admission
officers agree on these three being the most important, but what varies between the two
subject groups is the level of importance. Guidance counselors responded higher on the
Likert-scale than admission officers, concluding that the admission criteria were more
important to them than to admission officers.
It is interesting to note some of the characteristics of the sample. All guidance
counselors held a Master’s degree or higher, while admission officers held Bachelor’s or
higher. The guidance counselor and admission officer subject groups were made up of
74% and 55% females, respectively. Fifty-five percent of admission officers were at their
current institution for under five years, while guidance counselors responded almost
evenly to how long they have been working in their current school district. Lastly, 70%
of guidance counselors have held their current position for over five years, while majority
of admission officers (38%) have held their current position for one to three years.

53
This study provides considerable insight into the attitudes of admission criteria
from guidance counselors and admission officers in New Jersey. A clear disconnect was
discovered between the two subject groups on the importance of each of the admission
criteria. This disconnect could have an effect on high school students applying to college;
if guidance counselors believe that some of these criteria are extremely important, while
admission officers believe they are slightly important, guidance counselors may be
putting more emphasis on admission criteria that are not as important for a student to be
accepted into a four-year institution.
Recommendations for Practice
Based on my findings and conclusions of the study, the following are
recommendations for practice of the current admissions process in New Jersey:
1. Share results with guidance counselors and admissions officers across New
Jersey to inform them of the discrepancies found through the research.
2. Encourage more communication from admission officers to guidance
counselors about what criteria are most important to being accepted into their
institution.
3. Strengthen the relationships between local admissions officers and guidance
counselors to allow for students to have an easier application process.
Recommendations for Further Research
Based upon my findings and conclusions of the study, the following are
recommendation for further research into the current admissions process:
1. Future studies should involve a larger sample to generalize the results to both
populations to use the data across the country.
54
2. Vary the locations of the high schools and institutions studied to retrieve data
from a variety of demographics, school systems, institution types, and location in
the state.
3. Survey private institutions instead of only public to see if results vary between
institution types
4. Investigate the attitudes of the subject groups in a state other than New Jersey
5. Include students as a subject group to discover what attitudes students have
towards the admission criteria and to see if their perceptions line up with the
admissions officers and guidance counselors.
6. Utilize a qualitative research design to investigate why these admission criteria
are most important to these subject groups and see if their opinions vary from
their school or institution.
55
References
About NJACAC. (2017). Retrieved from https://www.njacac.org/about-njacac/
ACT, Inc. (2016). ACT profile report: National. Graduating class 2016. Retrieved from
https://www.act.org/content/dam/act/unsecured/documents/P_99_999999_N_S_
00_AT-GCPR_National.pdf
Admission Interview Tips. (n.d.). Retrieved from
https://professionals.collegeboard.org/guidance/applications/college-interviews
Atkinson, R. (2001, February). Standardized tests and access to American universities.
Paper presented at the Eighty-third Annual Meeting of American Council on
Education, Washington, D.C.
Beard, J., & Marini, J. P. (2015). Validity of the SAT
for Predicting First-Year Grades:
2012 SAT Validity Sample (College Board Research Report No. 2015-2). New
York: The College Board.
Betts Jr., A. L. (2011). Looking to the future: An examination of the potential for SAT
optional admissions. (Doctoral dissertation). Retrieved from Rowan Digital
Works.
Carlock, M. A. (2014). The use of the SAT in college admissions decisions. (Doctoral
dissertation). Retrieved from ProQuest Dissertations Publishing.
Class of 2016 SAT results. (2016). Retrieved from https://reports.collegeboard.org/sat
suiteprogram-results/class-of-2016-results
Clinedinst, M., Koranteng, A., & Nicola, T. (2015). 2015 State of college admission.
Retrieved from https://www.nacacnet.org/globalassets/documents/publications
/research/2015soca.pdf
Cohn, E., Cohn, S., Balch, D. C., Bradley Jr., J. (2004). Determinants of undergraduate
GPAs: SAT scores, high-school GPA and high-school rank. Economics of
Education Review, 23(6), 577-586.
District Factor Groups (DFG) for School Districts. (2000). Retrieved from
http://www.state.nj.us/education/finance/rda/dfg.shtml
Gaitlin, L. P. (1997). Comparing secondary school counselors’ and college admission
officials’ perceptions of selected college admissions criteria. (Doctoral
dissertation). Retrieved from ProQuest Dissertations Publishing.
Getler, L. A. (2007). Accepted or denial: What matters most in college admissions?
(Master’s Thesis). Retrieved from Rowan Digital Works.
56
Gilroy, M. (2007). Colleges making SAT optional as admissions requirement. Education
Digest: Essential Readings Condensed for Quick Review, 73(4), 35-39.
Help and FAQ’s. (2017). Retrieved from http://www.act.org/content/act/en/products-and
services/the-act/help.html#contactus
Hornberger, R. (2010). Predictors of academic success for conditionally admitted first
time freshmen at a four-year public university. (Doctoral dissertation). Retrieved
from ProQuest Dissertations Publishing.
Ishop, K. B. (2008). The college application essay: just tell me what to write and I’ll
write it. (Doctoral dissertation). Retrieved from ProQuest Dissertations
Publishing.
Kronholz, J. (2012). Academic values of non-academics: The case for keeping
extracurriculars. Education Next, 12(Winter 2012), 9-14.
Lawhorn, B. (2008). Extracurricular activities: The afterschool connection. Occupational
Outlook Quarterly, 52(4), 16-21.
Letukas, L. (2015). Nine facts about the SAT that might surprise you. Retrieved from
http://files.eric.ed.gov/fulltext/ED562751.pdf
Martin, C. J. (2015). Student involvement in extracurricular activities and post-secondary
education placement. (Doctoral dissertation). Retrieved from ProQuest
Dissertations Publishing.
McGinty, S. M. (2004). The college application essay: Revised edition. New York:
College Board.
Murphy, S. C., Klieger, D. M., Borneman, M. J., & Kuncel, N. R. (2009). The predictive
power of personal statements in admissions: A meta-analysis and cautionary tale.
College and University, 84(4), 83-86.
Nack, D. L. & Townsend, M. M. (2007). Are high school GPA, rank in high school
graduating class or ACT scores adequate predictors of college freshmen success?
(Doctoral dissertation). Retrieved from ProQuest Dissertations Publishing.
National Association for College Admission Counseling. (2000). Statement on Counselor
Competencies. Retrieved from https://www.nacacnet.org/globalassets/documents/
advocacy-and-ethics/statement-ofprinciples-of-good-
practice/counselorcompetencies.pdf

57
National Association for College Admission Counseling. (1990). Statement on precollege
guidance and counseling and the role of the school counselor. Retrieved from
https://www.nacacnet.org/globalassets/documents/advocacy-and-ethics/statement
ofprinciples-of-good-practice/roleofschlcounsnew.pdf
National Association for College Admission Counseling. (2016). Use of predictive
validity studies to inform admission practices. Retrieved from
https://www.nacacnet.org/news--publications/Research/report-validity-studies/
Richmond, L. (2011). Students’ college preparation level based on quality factors of the
high school attended. (Doctoral dissertation). Retrieved from ProQuest
Dissertations Publishing.
Shahani, C., Dipboye, R. L., & Gehrlein, T. M. (1991). The incremental contribution of
an interview to college admissions. Educational and Psychological Measurement,
51(4), 1049-1061.
Shaw, E. J., Marini, J.P., Beard, J., Shmueli, D., Young, L., & Ng, H. (2016). The
redesigned SAT pilot predictive validity study: A first look (College Board
Research Report No. 2016-1). New York: The College Board.
Tremblay, C. W. (2013). Agents of change: Roles, barriers, and opportunities for college
admissions professionals and high school counselors. College and University,
88(3), 12-27.
Zwick, R. (2007a). College admissions in twenty-first-century America: The roles of
grades, tests, and games of chance. Harvard Educational Review. 77(4), 419-429.
Zwick, R. (2007b). College admission testing. National Association for College
Admission Counseling, 1-44.
Zwick, R. (2013). Disentangling the role of high school grades, SAT scores, and SES in
predicting college achievement. (Research Report No. RR-13-09). Princeton, NJ:
Educational Testing Service.
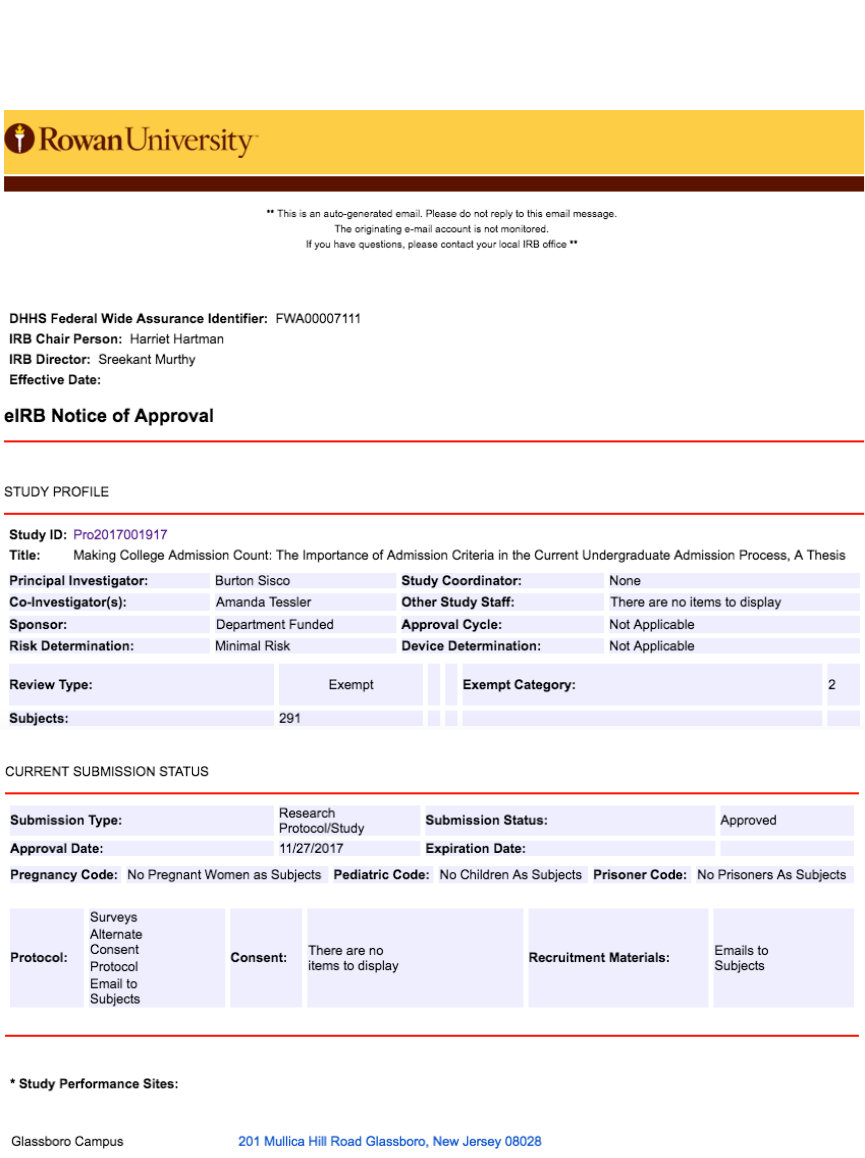
58
Appendix A
Institutional Review Board Approval

59
Appendix B
Initial Email to Potential Subjects
Good afternoon,
My name is Amanda Tessler and I am a graduate student at Rowan University. As part of
a requirement for my M.A. in Higher Education Administration, I am conducting a thesis
that explores the attitudes of college admission requirements between admission officers
and guidance counselors in New Jersey.
As higher education continues to change, the common question from potential students is,
“What are the most important qualifications for a student to be accepted into four-year
institutions?” This study hopes to discover what these criteria are to both guidance
counselors and admission officers in the local area.
Since you fit into one of these positions I am researching, I am asking you to help me
discover the differences and similarities in attitudes of college admission requirements by
taking a quick survey. The survey will take no more than ten minutes to complete with no
identifying information being asked and all responses being kept confidential. By taking
your time to complete this survey, you will be helping to clear up any misconceptions
about college admission requirements to current and future high school seniors.
Thank you in advanced for your participation. If you have any questions or concerns,
please contact me at [email protected] or my thesis chair, Dr. Burton Sisco,
Follow this link to the Survey:
[Survey Link]
Or copy and paste the URL below into your internet browser:
[Survey Link]
Thank you again for your participation.
Sincerely,
Amanda Tessler
M.A. Higher Education Administration
Rowan University, 2018
60
Appendix C
Reminder Email to Potential Subjects
Good Morning,
My name is Amanda Tessler and I am a graduate student at Rowan University. Last
week, I emailed you a survey seeking information on your opinions of college admission
criteria for my graduate thesis requirement. I understand that this is a busy time for you,
but it’s very important for your opinions to be included in this study. The link for the
survey is in this email for your convenience.
The survey will take no more than ten minutes to complete with no identifying
information being asked and all responses being kept confidential. By taking your time to
complete this survey, you will be helping to clear up any misconceptions about college
admission requirements to current and future high school seniors.
Thank you in advanced for your participation. If you have any questions or concerns,
please contact me at [email protected] or my thesis chair, Dr. Burton Sisco,
Follow this link to the Survey:
[Survey Link]
Or copy and paste the URL below into your internet browser:
[Survey Link]
Follow the link to opt out of future emails:
[Unsubscribe Link]
Thank you again for your participation.
Sincerely,
Amanda Tessler
M.A. Higher Education Administration
Rowan University, 2018
61
Appendix D
Online Alternate Consent
You are invited to participate in this online research survey entitled Making College
Admission Count: The Importance of Admission Criteria in the Current Undergraduate
Admission Process. You are included in this survey because you are either an admissions
professional at a New Jersey institution or a high school guidance counselor in New
Jersey. The number of subjects to be enrolled in the study will be approximately 300.
The survey may take approximately 10-15 minutes to complete. Your participation is
voluntary. If you do not wish to participate in this survey, do not respond to this online
survey. Completing this survey indicates that you are voluntarily giving consent to
participate in the survey. Data collection for this survey is expected to last approximately
two months.
The purpose of this research study is to discover and compare the attitudes of various
college admission criteria between high school guidance counselors and college
admission officers. The study seeks to focus on what is most important for being
accepted into an undergraduate program at a four-year institution in New Jersey, as well
as discovering the similarities and differences between attitudes of guidance counselors
and admission officers. Approximately 300 professionals from New Jersey will be
contacted for participation in this study.
There are no risks or discomforts associated with this survey. There may be no direct
benefit to you, however, by participating in this study, you may help to understand the
current college admission process, according to high school guidance counselors and
college admission officers, and help make the admission process easier to understand for
high school students in New Jersey.
Your response will be kept confidential. I will store the data in a secure computer file
and the file will be destroyed once the data has been analyzed, and the thesis is approved.
Any part of the research that is published as part of this study will not include your
individual information. If you have any questions about the survey, you can contact me
or my thesis chair at the email addresses provided below, but you do not have to give
your personal identification.
Please complete the checkbox below.
To participate in this survey, you must be 18 years or older and have access to this
survey. Place a check box here ☐
Completing this survey indicates that you are voluntarily giving consent to participate in
the survey ☐
62
Researcher Contact Information:
Amanda Tessler
Rowan University
Burton Sisco, Ed.D
Rowan University, Thesis Chair
63
Appendix E
Survey for Admission Officers
Section 1: Demographics
1. Sex
☐Male
☐Female
☐Other
2. Age
☐Under 30
☐30-39
☐40-49
☐50+
3. Education
☐High School/GED
☐Some college
☐Bachelor’s Degree
☐Master’s Degree
☐Doctoral Degree
4. How long have you been working for
your current institution?
☐Less than 5 years
☐5-10 years
☐11-15 years
☐Over 15 years
5. How long have you been in your
current position?
☐Less than one year
☐1-3 years
☐4-5 years
☐Over 5 years
6. Have you read any past or current
research relating to SAT scores and
predictability of academic success?
☐Yes
☐No
☐Unsure
Section 2: Admission Requirements
Please choose a number from 1-5 (not important to most important) for each of the
following statements to indicate how important the following criteria are for high school
seniors to being accepted into your institution.
1= Not important
2= Less important
3= Important
4= Very important
5= Most important
1. SAT/ACT scores: 1 2 3 4 5
2. High school GPA: 1 2 3 4 5
3. High school class rank: 1 2 3 4 5
4. Extra-curricular activities: 1 2 3 4 5
5. Personal Essay: 1 2 3 4 5
6. Letters of recommendation: 1 2 3 4 5
7. Interviews: 1 2 3 4 5
8. District Factor Grouping: 1 2 3 4 5
9. Course load and Transcript: 1 2 3 4 5
64
Section 3: Open-ended
1. Out of the criteria listed, which two are considered most important for a student to be
accepted into your institution?
2. Out of the criteria listed, which one criterion best predicts academic success?
Thank you for your participation in this survey.
If you have any questions or concerns, please email [email protected]
65
Appendix F
Survey for Guidance Counselors
Section 1: Demographics
1. Sex
☐Male
☐Female
☐Other
2. Age
☐Under 30
☐30-39
☐40-49
☐50+
3. Education
☐High School/GED
☐Some college
☐Bachelor’s Degree
☐Master’s Degree
☐Doctoral Degree
4. How long have you been working for
your current school/school district?
☐Less than 5 years
☐5-10 years
☐11-15 years
☐Over 15 years
5. How long have you been in your
current position?
☐Less than one year
☐1-3 years
☐4-5 years
☐Over 5 years
6. Have you read any past or current
research relating to SAT scores and
predictability of academic success?
☐Yes
☐No
☐Unsure
Section 2: Admission Requirements
Please choose a number from 1-5 (not important to most important) for each of the
following statements to indicate how important the following criteria are for high school
seniors to being accepted into a four-year institution.
1= Not important
2= Less important
3= Important
4= Very important
5= Most important
1. SAT/ACT scores: 1 2 3 4 5
2. High school GPA: 1 2 3 4 5
3. High school class rank: 1 2 3 4 5
4. Extra-curricular activities: 1 2 3 4 5
5. Personal Essay: 1 2 3 4 5
6. Letters of recommendation: 1 2 3 4 5
7. Interviews: 1 2 3 4 5
8. District Factor Grouping: 1 2 3 4 5
9. Course load and Transcript: 1 2 3 4 5
66
Section 3: Open-ended
1. Out of the criteria listed, which two are considered most important for a student to be
accepted into a four-year institution?
2. Out of the criteria listed, which one criterion best predicts academic success?
Thank you for your participation in this survey.
If you have any questions or concerns, please email [email protected].
