Affordable
Housing
in Ghana
SECTOR STUDY

List of abbreviations . . . . . . . . . . . . . . . . . . . . . . . . . . . . . . . . 5
Executive summary . . . . . . . . . . . . . . . . . . . . . . . . . . . . . . . . . 6
Introduction . . . . . . . . . . . . . . . . . . . . . . . . . . . . . . . . . . . . . 7
Research approach . . . . . . . . . . . . . . . . . . . . . . . . . . . . . . . . . 8
Views on affordable housing. . . . . . . . . . . . . . . . . . . . . . . . . . . . 9
Understanding Ghana’s housing and demand . . . . . . . . . . . . . . . . . 12
Trends in types of housing (2000 to 2014) . . . . . . . . . . . . . . . . . . . . . . . . . . . 14
Housing materials (external walling). . . . . . . . . . . . . . . . . . . . . . . . . . . . . . 15
Housing types by occupancy . . . . . . . . . . . . . . . . . . . . . . . . . . . . . . . . . . 16
Housing tenure . . . . . . . . . . . . . . . . . . . . . . . . . . . . . . . . . . . . . . . . . . 18
Estimated market volume for affordable housing in Ghana . . . . . . . . . . . . . . . . . 19
Interesting areas for affordable housing. . . . . . . . . . . . . . . . . . . . . . . . . . . . 24
Affordable housing interventions in Ghana . . . . . . . . . . . . . . . . . . 26
State and quasi-state interventions . . . . . . . . . . . . . . . . . . . . . . . . . . . . . . 26
Non-state housing interventions – housing cooperatives . . . . . . . . . . . . . . . . . . 27
Tema Housing Cooperative (THC) . . . . . . . . . . . . . . . . . . . . . . . . . . . . . . 27
Private sector interventions. . . . . . . . . . . . . . . . . . . . . . . . . . . . . . . . . . . 28
Blue Rose Ltd . . . . . . . . . . . . . . . . . . . . . . . . . . . . . . . . . . . . . . . . . 28
Tamale Affordable Housing Project . . . . . . . . . . . . . . . . . . . . . . . . . . . . . 29
TAMSUF Affordable Housing Project in Ashaiman Municipality . . . . . . . . . . . . . . 30
Addressing the challenges of affordable housing . . . . . . . . . . . . . . . 31
Size of the affordable housing market . . . . . . . . . . . . . . . . . . . . . . . . . . . . . 31
The housing value chain. . . . . . . . . . . . . . . . . . . . . . . . . . . . . . . . . . . . . 31
Home extension, improvement and completion schemes . . . . . . . . . . . . . . . . 32
Maintenance and retrofitting. . . . . . . . . . . . . . . . . . . . . . . . . . . . . . . . . 32
Construction of new units . . . . . . . . . . . . . . . . . . . . . . . . . . . . . . . . . . 33
Standardisation of labour and local building materials. . . . . . . . . . . . . . . . . . 33
Matrix of business opportunities . . . . . . . . . . . . . . . . . . . . . . . . . . . . . . . . 34
Strategies for affordable housing delivery. . . . . . . . . . . . . . . . . . . . . . . . . . . 34
Labour and materials . . . . . . . . . . . . . . . . . . . . . . . . . . . . . . . . . . . . . 34
Land supply and location. . . . . . . . . . . . . . . . . . . . . . . . . . . . . . . . . . . 35
Financing. . . . . . . . . . . . . . . . . . . . . . . . . . . . . . . . . . . . . . . . . . . . 35
Urban infrastructure and municipal services. . . . . . . . . . . . . . . . . . . . . . . . 35
CONTENT
Customer and value proposition . . . . . . . . . . . . . . . . . . . . . . . . 36
Financing mechanisms available for affordable housing . . . . . . . . . . . 42
Self-financing. . . . . . . . . . . . . . . . . . . . . . . . . . . . . . . . . . . . . . . . . . . 42
Loans from informal borrowing, non-financial institutions and banks . . . . . . . . . . . 43
Mortgages from banks and non-bank institutions . . . . . . . . . . . . . . . . . . . . . . 45
Remittances. . . . . . . . . . . . . . . . . . . . . . . . . . . . . . . . . . . . . . . . . . . .
46
Public budgetary allocations, subsidies and collaborative efforts . . . . . . . . . . . . . 46
Key stakeholders in the affordable housing market . . . . . . . . . . . . . . 47
Conclusion . . . . . . . . . . . . . . . . . . . . . . . . . . . . . . . . . . . . . 49
Annex 1: Available Literature on Housing in Ghana . . . . . . . . . . . . . . 50
Annex 2: Housing interventions . . . . . . . . . . . . . . . . . . . . . . . . . 52
The Inclusive Business Action Network
(IBAN) promotes inclusive business
globally – by supporting the scale and
replication of inclusive business mo-
dels and engaging all different types
of stakeholders. To trigger collective
action IBAN ‘connects the dots’ between
the vast number of businesses, existing
initiatives, networks and stakeholders
around the world. On a global, regional
and national level, it facilitates access
to knowledge and information, enables
peerlearning and exchange formats and
fosters partnerships.
INCLUSIVE BUSINESS ACTION NETWORK (IBAN)
ACKNOWLEDGEMENTS
With this report, IBAN commissioned three Ghanaian affordable housing experts, Sarfoh,
Kwadwo Ohene, Kavaarpuo, Godwin and Ayitio, Joseph to conduct a study on the current
stage of the sector.
EXPERTS
Experts on inclusive business and affordable housing contributed to this publication,
providing their feedback and also sharing their experience. We are particularly grateful to
Alfred Berkoh, Ellen Oteng-Nsiah, Tony Asare, Farouk Braimah and Maja Rotter.

CAHF Centre for Affordable Housing Finance
GAMA Greater Accra Metropolitan Area
GHL Ghana Home Loans Ltd
GHS Ghanaian Cedi
GIZ Deutsche Gesellschaft für Internationale Zusammenarbeit GmbH
GLSS Ghana Living Standards Survey
GREDA Ghana Real Estate Developers’ Association
GSS Ghana Statistical Service
HC:Y Housing cost to income ratio
IBAN Inclusive Business Action Network
MWRWH Ministry of Water Resources, Works and Housing
NBFI Non-bank financial institution
PHC Population and Housing Census
R&D Research and development
SADA Savannah Accelerated Development Authority
SHC State Housing Corporation
SSNIT Social Security and National Insurance Trust
SUF Slum Upgrading Facility (UN-HABITAT)
TAMSUF Tema Ashaiman Municipal Slum Upgrading Facility
TCCU Tamale Cooperative Credit Union
THC Tema Housing Cooperative
UESP Urban Environmental Sanitation Project
UN-HABITAT United Nations Human Settlements Programme
USAID United States Agency for International Development
ABBREVIATIONS
BOX 1 Policy view on affordable housing . . . . . . . . . . . . . . . . . . . . . . . . . . . . . 9
BOX 2 Stakeholder views on affordable housing . . . . . . . . . . . . . . . . . . . . . . . . 10
BOX 3 Key figures for Ghana . . . . . . . . . . . . . . . . . . . . . . . . . . . . . . . . . . . .11
BOX 4 Making housing affordable . . . . . . . . . . . . . . . . . . . . . . . . . . . . . . . . 35
BOX 5 Methodologies for estimating housing stock . . . . . . . . . . . . . . . . . . . . . . 52
BOXES
FIGURE 1 Percentage changes in demographics and housing stock . . . . . . . . . . . . . .12
FIGURE 2 Rooms occupied by households in urban and rural areas (2000 to 2010) . . . . .17
FIGURE 3 Housing affordability pyramid . . . . . . . . . . . . . . . . . . . . . . . . . . . . 23
FIGURE 4 Housing affordability in Ghana . . . . . . . . . . . . . . . . . . . . . . . . . . . . 23
FIGURE 5 A two-bedroom terrace house. . . . . . . . . . . . . . . . . . . . . . . . . . . . . 28
FIGURE 6 The housing value chain. . . . . . . . . . . . . . . . . . . . . . . . . . . . . . . . .31
FIGURE 7 Cost components of a typical house built by the formal private sector. . . . . . 33
FIGURE 8 Identified housing sector stakeholders in Ghana . . . . . . . . . . . . . . . . . . .47
TABLE 1 Existing housing stock and households in 2010. . . . . . . . . . . . . . . . . . . .13
TABLE 2 Trends in housing typology in Ghana. . . . . . . . . . . . . . . . . . . . . . . . . .14
TABLE 3 Summary of the main materials used for external walling. . . . . . . . . . . . . .15
TABLE 4 Room occupancy in different localities. . . . . . . . . . . . . . . . . . . . . . . . .16
TABLE 5 Sleeping rooms per household in various localities . . . . . . . . . . . . . . . . .17
TABLE 6 Housing tenure . . . . . . . . . . . . . . . . . . . . . . . . . . . . . . . . . . . . . 18
TABLE 7 Estimated housing need . . . . . . . . . . . . . . . . . . . . . . . . . . . . . . . . .19
TABLE 8 Analysis of housing need (2000 to 2025) . . . . . . . . . . . . . . . . . . . . . . . 20
TABLE 9 Value of the affordable housing market . . . . . . . . . . . . . . . . . . . . . . . .21
TABLE 10 Housing expenditure by quintile group and type of locality. . . . . . . . . . . . 22
TABLE 11 Annual income and expenditure on rent. . . . . . . . . . . . . . . . . . . . . . . 22
TABLE 12 Affordability determined using mean household income from GLSS 6,
indexed to 2016 . . . . . . . . . . . . . . . . . . . . . . . . . . . . . . . . . . . . . 23
TABLE 13 Matrix of business opportunities. . . . . . . . . . . . . . . . . . . . . . . . . . . 34
TABLE 14 Top five sources of household loans in 2008 and 2014* . . . . . . . . . . . . . . 43
TABLE 15 Purposes for which loans were taken out . . . . . . . . . . . . . . . . . . . . . . 43
TABLE 16 Loan portfolio of the top four NBFIs in 2013 . . . . . . . . . . . . . . . . . . . . 44
TABLE 17 The Ghanaian mortgage market in 2013. . . . . . . . . . . . . . . . . . . . . . . 45
TABLE 18 Interest rates on mortgages of selected banks in 2013 . . . . . . . . . . . . . . 45
TABLE 19 Institutional arrangement of the affordable housing sector . . . . . . . . . . . 48
TABLE 20 Summary of major government housing initiatives since Ghana's independence 52
TABLE 21 Changes in Ghana's demographics and housing stock (1960–2010) . . . . . . . 53
TABLE 22 Summary of key barriers/enablers for affordable and inclusive housing projects 54
FIGURES AND TABLES
76
EXECUTIVE SUMMARY
Access to decent and adequate housing is often considered as a basic human right.
However, low-income households face difficulties in accessing not only affordable
housing solutions but also housing of good quality. In Ghana both the informal and for-
mal sector supply of housing continues to be inadequate to meet the increasing demand.
This has resulted in acute and persistent housing deficits — a situation that presents a
complex mix of both challenges and opportunities. This report sets out the major issues
affecting affordable housing provision and seeks to present a business case for formal
private sector interventions in affordable housing in the country.
Housing conditions in Ghana
Housing supply is dominated by informal sector
operations with over 90% of the country’s housing
stock built incrementally by homeowners and
small-scale contractors which typically takes 5
to 15 years to complete. A significant proportion
of the houses built in this way are of a typology
known colloquially as compound houses. In urban
areas one in two households dwell in this kind of
communal housing type. Another significant ty-
pology is detached bungalow-type housing, which
in 2010 constituted 28.7% of the country’s total
housing stock.
There are notable differences with respect to the
building materials used across localities. In rural
areas, the building envelope of 55% of houses are
either mud or earth-based, whereas 85% of houses
in urban areas are sandcrete. Sandcrete is often
associated with modernity and there is a gradual
transition in the use to sandcrete based materials
as it is associated with modernity. As sandcrete
becomes more popular, local building materials
are being used less and less. This is problematic
because using local earth and clay building ma-
terials reduces housebuilding costs and reduces
post-construction costs on occupants given these
materials’ energy-saving properties.
In terms of house tenure, two in five households
in Accra, occupy rented accommodation while
some 27% of households live in rent-free arrange-
ments. In rural areas, three out of five households
own their dwellings. One-third of households in
both rural and urban areas occupy more than
two sleeping rooms while about 2.7 million urban
households occupy single-rooms. This situation
combined with the extent of rent-free occupancy
and the national average of 4.4 persons per house-
hold is indicative of serious overcrowding.
Affordable housing market and potentials
Housing affordability
Housing sold on the formal real estate market is
beyond the financial means of most households,
with only about 1% of households able to afford
the cheapest houses offered by formal developers.
For example, in 2015 the cheapest house cost USD
24,297. After paying the 20% deposit, the mortgagee
is required to make a monthly payment of USD 245
over a 20-year period and must have a monthly
income of USD 612 to quality. Meanwhile, monthly
income of households average USD 347.
Bank lending rates are standing at around 30% per
annum and thus housing finance is out of reach of
virtually all but those on high incomes households.
For example, average household incomes reported
in 2014 stood at GHS 16,644 (GSS 2014). Using the
housing cost-to-income metric, households able to
spend three times their annual incomes would be
able to afford accommodation worth USD 14,000.
Customer and value proposition
For the report, a limited survey of selected stake-
holders was carried out exploring what constitu-
tes ‘affordable’ housing. For private developers,
affordability is both a function of the quality of
the building fabric and the price relative to the
income of a target group. For financiers, it is linked
to a certain, arbitrarily-set price point related to
the cost of housing. For low-income households,
it is determined by price, build quality and loca-
tion. These different perspectives suggest that
affordability means different things to different
people. Affordability is thus seen differently by
different stakeholders depending on their function
along the housing value chain.
H
owever, this level of production only addres-
ses about 35% of the annual demand for new
housing (UN-HABITAT 2008). Given that the
recent boom in the real estate market distinctly
favours high-income households, which constitute
only 5% of the population, this deficit appears to
mainly affect the larger part of the housing market
that is persistently overlooked by market forces.
Previous approaches of successive governments to
directly provide housing have seldom achieved their
objectives. With both formal and informal housing
delivery inadequately meeting demand of all market
segments, the market presents both challenges and
opportunities particularly for low income housing
which is not addressed by the market.
This report presents the essential issues affecting
the provision of affordable housing in Ghana with
the aim of making a business case for the partici-
pation of multiple private and non-state actors and
interests in a more concerted fashion. Drawing on
Ghana’s 2015 National Housing Policy and on the
perspectives of key stakeholders representing diffe-
rent interests in the housing sector, the report pro-
vides a contextualised understanding of affordable
housing.
The report makes use of various estimations of the
housing demand situation and identifies the types
of affordable housing available on the market and
the financing mechanisms employed to deliver
lower-cost housing. Importantly, the report consi-
ders the segment of the housing sub-market that
can catalyse changes in the delivery of and access
to affordable housing. The report’s contents also
provided the background for dialogues at the three-
day workshop Affordable Housing in Ghana, held on
28–30 June 2016 and organised in partnership with
the World Bank. It is hoped that the contents of this
report prompt further discussions on this subject,
provide the ingredients to support sustainable inter-
ventions and introduce key players to the risks and
opportunities associated with the affordable housing
sub-market. Moreover, it is hoped that the combined
impact of the report and workshops fosters part-
nerships that result in the development of sustain-
able and scalable business solutions to address the
challenges of the affordable housing market.
Ghana’s real estate market is largely based on informal sector activities
1
— both for
supplying and allocating housing units. The housing market currently appears to be
experiencing significant investment and growth, arising from the country’s econo-
mic growth, oil discovery and exploration, and remittances. The numerous construc-
tion cranes visible over major cities like Accra, Tema and Kumasi serve to reinforce
this notion of a country on the up. Housing supply has undoubtedly enjoyed positi-
ve growth rates over the years. In 2008 supply was estimated at between 25,000 to
40,000 units per annum, representing a threefold increase on the previous decade.
Introduction
1
98
Qualitative research methods are useful for understanding the state of the housing
sector in Ghana. In qualitative inquiry, the aim is to explore a phenomenon in-depth,
which aligns with the objectives of this report. To better understand the dynamics of
affordable housing and propose practical recommendations, the authors purpose-
fully selected units of inquiry and data sources that allowed them us to learn from
and critically review housing interventions in the country. This involved undertaking
a desk study of secondary data – namely policies, programmes, projects, institutio-
nal frameworks, position papers and market reports on housing in Ghana. A list of
key literature on affordable housing in the country is provided in Appendix 1.
Research approach
2
T
he authors of the report, which is largely
based on the above-mentioned desk study,
drew on relevant literature to establish its
conceptual basis for affordable housing. This re-
view was supplemented with limited primary data
gathered from carefully selected stakeholders in
interviews that sought to further contextualise and
validate the conceptual basis established as well
as to generate inputs for the affordable housing
workshop. To develop understanding and thus
establish the framework for the formulation of
appropriate solutions, primary data respondents
were selected using parameters such as income
and socio-economic status, and education levels.
The profiles of these respondents are provided
later in this report. Participants in the primary data
collection exercise were sampled loosely
2
from
housing developers, mortgage financiers, public
policy experts and slum residents. In total, five
slum residents (one from each of the major slums
in Accra), one housing finance company represen-
tative, one formal private developer, one public
officer and two housing experts were interviewed
to augment the findings of the literature review.
A
ffordable housing is a concept that is
heavily influenced by the local context and
is therefore not easy to subject to global
norms. For some, its definition is a function of
household income and expenditure, benchmar-
ked not to exceed a ceiling relative to the overall
household income or expenditure, averaging 30%
(O’Dell, W. O., Smith M. and White D. 2004). However,
this varies between countries – for example, Cana-
da until the 1980s used a 25% household income
threshold (Hulchanski 2005). In India, a ceiling
of 40% is applied (Jones Lang LaSalle 2012), with
affordability measured according to the economic
status of a household. A variation of this definition
looks at how to make housing accessible to the
poor, who are defined as those with a household
income threshold of under USD 2 per day.
3
Others
define affordable housing as housing with costs
at or below a fixed price point, sometimes arbit-
rarily set, and deemed to be accessible to those
on lower incomes (Angel 2001). A variation on this
definition uses public subsidies as a factor for
determining what constitutes affordable housing
(which is defined in certain quarters as low-cost
housing that requires supply-side subsidies).
Elsewhere, affordable housing is broadly defined
as housing that is adequate in quality and location
and does not cost so much that it leaves its occu-
pants unable to meet their other basic living costs
or threatens their enjoyment of other basic human
rights (McBride et al. 2011). Here, other elements of
affordability come into play: quality, income, locati-
on, costs, and enjoyment of basic human rights. In
this regard, affordable housing is defined in some
cases to be housing of a specific size (determined
either by number of rooms or space) or of mini-
mum quality.
Box 2 below presents the differing views of what
constitutes affordable housing expressed by a
selection of interviewed stakeholders.
There are several different understandings of what constitutes affordable
housing, who is entitled to it and what role different stakeholders are required
to play in order to deliver housing and allocate it to beneficiaries. Box 1 below
contains the 2015 National Housing Policy’s definition of affordable housing.
Views on affordable housing
3
The ability of a household to spend up to thirty
percent (30%) of its gross annual income on
the rent or purchase price of housing where
the rent or purchase price includes applicable
taxes and insurances and utilities. When the
annual carrying cost of a home exceeds thirty
percent (30%) of household income, then it is
considered unaffordable for that household.
MWRWH 2015, p. V
NATIONAL POLICY PERSPECTIVET
Box 1 • POLICY VIEW ON AFFORDABLE HOUSING
Photo: peeterv/istockphoto.com
1110
A PRIVATE DEVELOPER’S VIEW
‘Affordability is relative and hence affordable
housing is decent accommodation, with at least
wet areas, that meets the target group’s needs.
The housing must have as a minimum a decent
toilet and bath and its cost must be relative to
the financial capacity of the target group.’
Managing director of a private propertydeveloper
A FINANCIER’S VIEW
‘An affordable house in Ghana is a house whose
cost ranges from GHS 100,000 to GHS 200,000,
taking into consideration people’s incomes and
the feasibility of the construction costs. A house
is only affordable because people have the
money to buy, or can access a mortgage to buy,
the property.’
Technical officer of a mortgage provider
Box 2 • STAKEHOLDER VIEWS ON AFFORDABLE HOUSING
In this report the definition of affordable housing
as ‘housing solutions which are priced or financed
in a way that enables low-income households … to
also be able to afford other basic needs’ (GIZ 2014,
p. 9) is used. The low-income households referred
to here are those that fall within the bottom two
income quintiles. Though used more loosely in
this report, the concept of affordability is linked
specifically with households occupying the base of
the economic pyramid — i.e. low-income earners.
4
In this case, housing solutions must be modelled
in relation to the purchasing power of prospective
owners or renters. This introduces flexibility into
the definition, as incomes and wages are often
location-specific. As such, a solution appropriate
for one area might not necessarily work in ano-
ther. Other locational issues; proximity to social
and civic services, economic opportunities and
social networks are critical in the decisions of low
income earners in choosing to reside in a particu-
lar neighbourhood. The element of basic needs is
equally important with regard to making housing
accessible. Houses should not be priced in a way
that compromises the resident households’ ability
to satisfy their other needs.
Research on affordable housing in Ghana is often
framed in terms of the public provision of af-
fordable housing and the mediatory role of state
institutions, with researchers considering whether
public policy would be able to alleviate the preca-
rious housing situation of the urban poor. With the
issues framed in these terms, the resulting studies
have tended to focus on the state’s attempts to
provide housing for low-income households, the
existing public financing options (Bank of Ghana
2006) and the influence of state policy in achieving
those aims. For instance, some scholars (Kona-
du-Agyeman 2001 and Sarfoh 2010) have examined
Ghana’s housing policy experience from the
pre-colonial era to contemporary Ghana, looking
at adopted policies and programmes in the light
of international discourse and the core–periphery
argument versus neoliberal and communitarian
approaches. Arku (2009) investigated the economic
logic of housing policies from 1929 to 1966 and
observed that colonial governments seldom acted
to provide housing for indigenous peoples except
occasionally for political and social motives. For
Sarfoh (2010), the direction of housing policy over
the years has been characterised by uncertainty
owing to (a) shifts in the orientation of governance
and the economic paradigms of global players and
(b) the strategic positioning of local actors as glo-
bal norms were reinterpreted. This uncertainty in
housing policy direction is epitomised by the coun-
try’s repeatedly unsuccessful efforts to develop a
comprehensive housing policy prior to 2015, when
a national housing policy was finally promulgated.
Others have considered the relationship between
who is building and what is being built in urban
Ghana (Tipple et al. 1998, and Korboe 1992). On the
question of who is building, Tipple et al. assert that
the motivation for house construction in urban
Ghana is to guarantee security of tenure. Other
studies, such as Karley and Akomea 2007 and
Obeng-Oddom 2011, examine the prospects and
challenges in the real estate sector. A key conside
-
ration in most of the existing studies is affordabi-
lity and the associated strategies for improving
access to affordable housing, albeit without a
clarification of the competing notions of this con-
cept (Boamah 2010). Awanyo (2009) draws attention
to the need to leverage already ubiquitous in-situ
building strategies, as a way of meeting housing
space demands among low-income earners. For
Tipple (1996) it is house extension that offers the
potential for affordable and sustainable housing.
In this approach, as a minimum the wet areas
(kitchen, bath and toilet) and at least one sleeping
area are completed for use, and options for later
expansion incorporated.
5
However, this kind of
piecemeal approach tends to lock up capital over a
considerable time.
Other studies mainly carried out by international
organisations attempt to provide a panoramic view
of the sector (e.g. CAHF, 2013; UN-Habitat, 2010;
UN-Habitat, 2011; World Bank, 2009; and UN-HAB-
ITAT, 2004). These present overviews of the housing
sector that examine the issues in aggregate
(covering land issues, finance, policy, institutional
aspects, housing needs and interventions, among
others) rather than focus on a particular sub-sec-
tor.
These studies do not look at the housing value
chain or the socially stratified lower-scale issues
of affordable housing in Ghana that are specific to
the poor. Neither do they explore the role of the
private sector in tackling these issues. Yet, given
the private sector’s understanding of the dynamics
of affordable housing provision, the housing mar-
ket and the mediatory roles of institutions, it has
a particularly crucial role to play in policy-making
and harmonious local economic development. It
is this gap that this report attempts to address by
providing a better understanding of the affordable
housing market.
28,5 MILLION
Population
54%
Urban population (% of total)
4,5%
Urbanisation rate (in 2014)
24.2%
Population under national poverty line
GHS 8
National daily minimum wage
21.4%
Proportion of employed population in informal sector
43.8%
Population living in slums
0.25
Mortgage to GDP ratio (in 2010)
70
Ease of doing business ranking (out of 189)
5
Number of procedures to register a property
46 DAYS
Time required to register property
1.10%
Cost, as a % of property value, of registering property
Box 3 • KEY FIGURES FOR GHANA
CAHF 2015, GSS 2014, UN-Habitat 2014, and Ministry of
Local Government and Rural Development 2013.
1312
Ghana’s 2010 Population and Housing Census (PHC) recorded the country’s
population as 24.6 million, of whom approximately half live in urban areas.
6
The
concentration is such that the primary cities of Kumasi, Sekondi-Takoradi and Ac-
cra, all of which are in the south of the country, hold more than 28% of the coun-
try’s population.
7
Furthermore, housing stock, the number of households and the
number of households per house all reflect this trend towards urbanisation.
Understanding Ghana’s
housing and demand
4
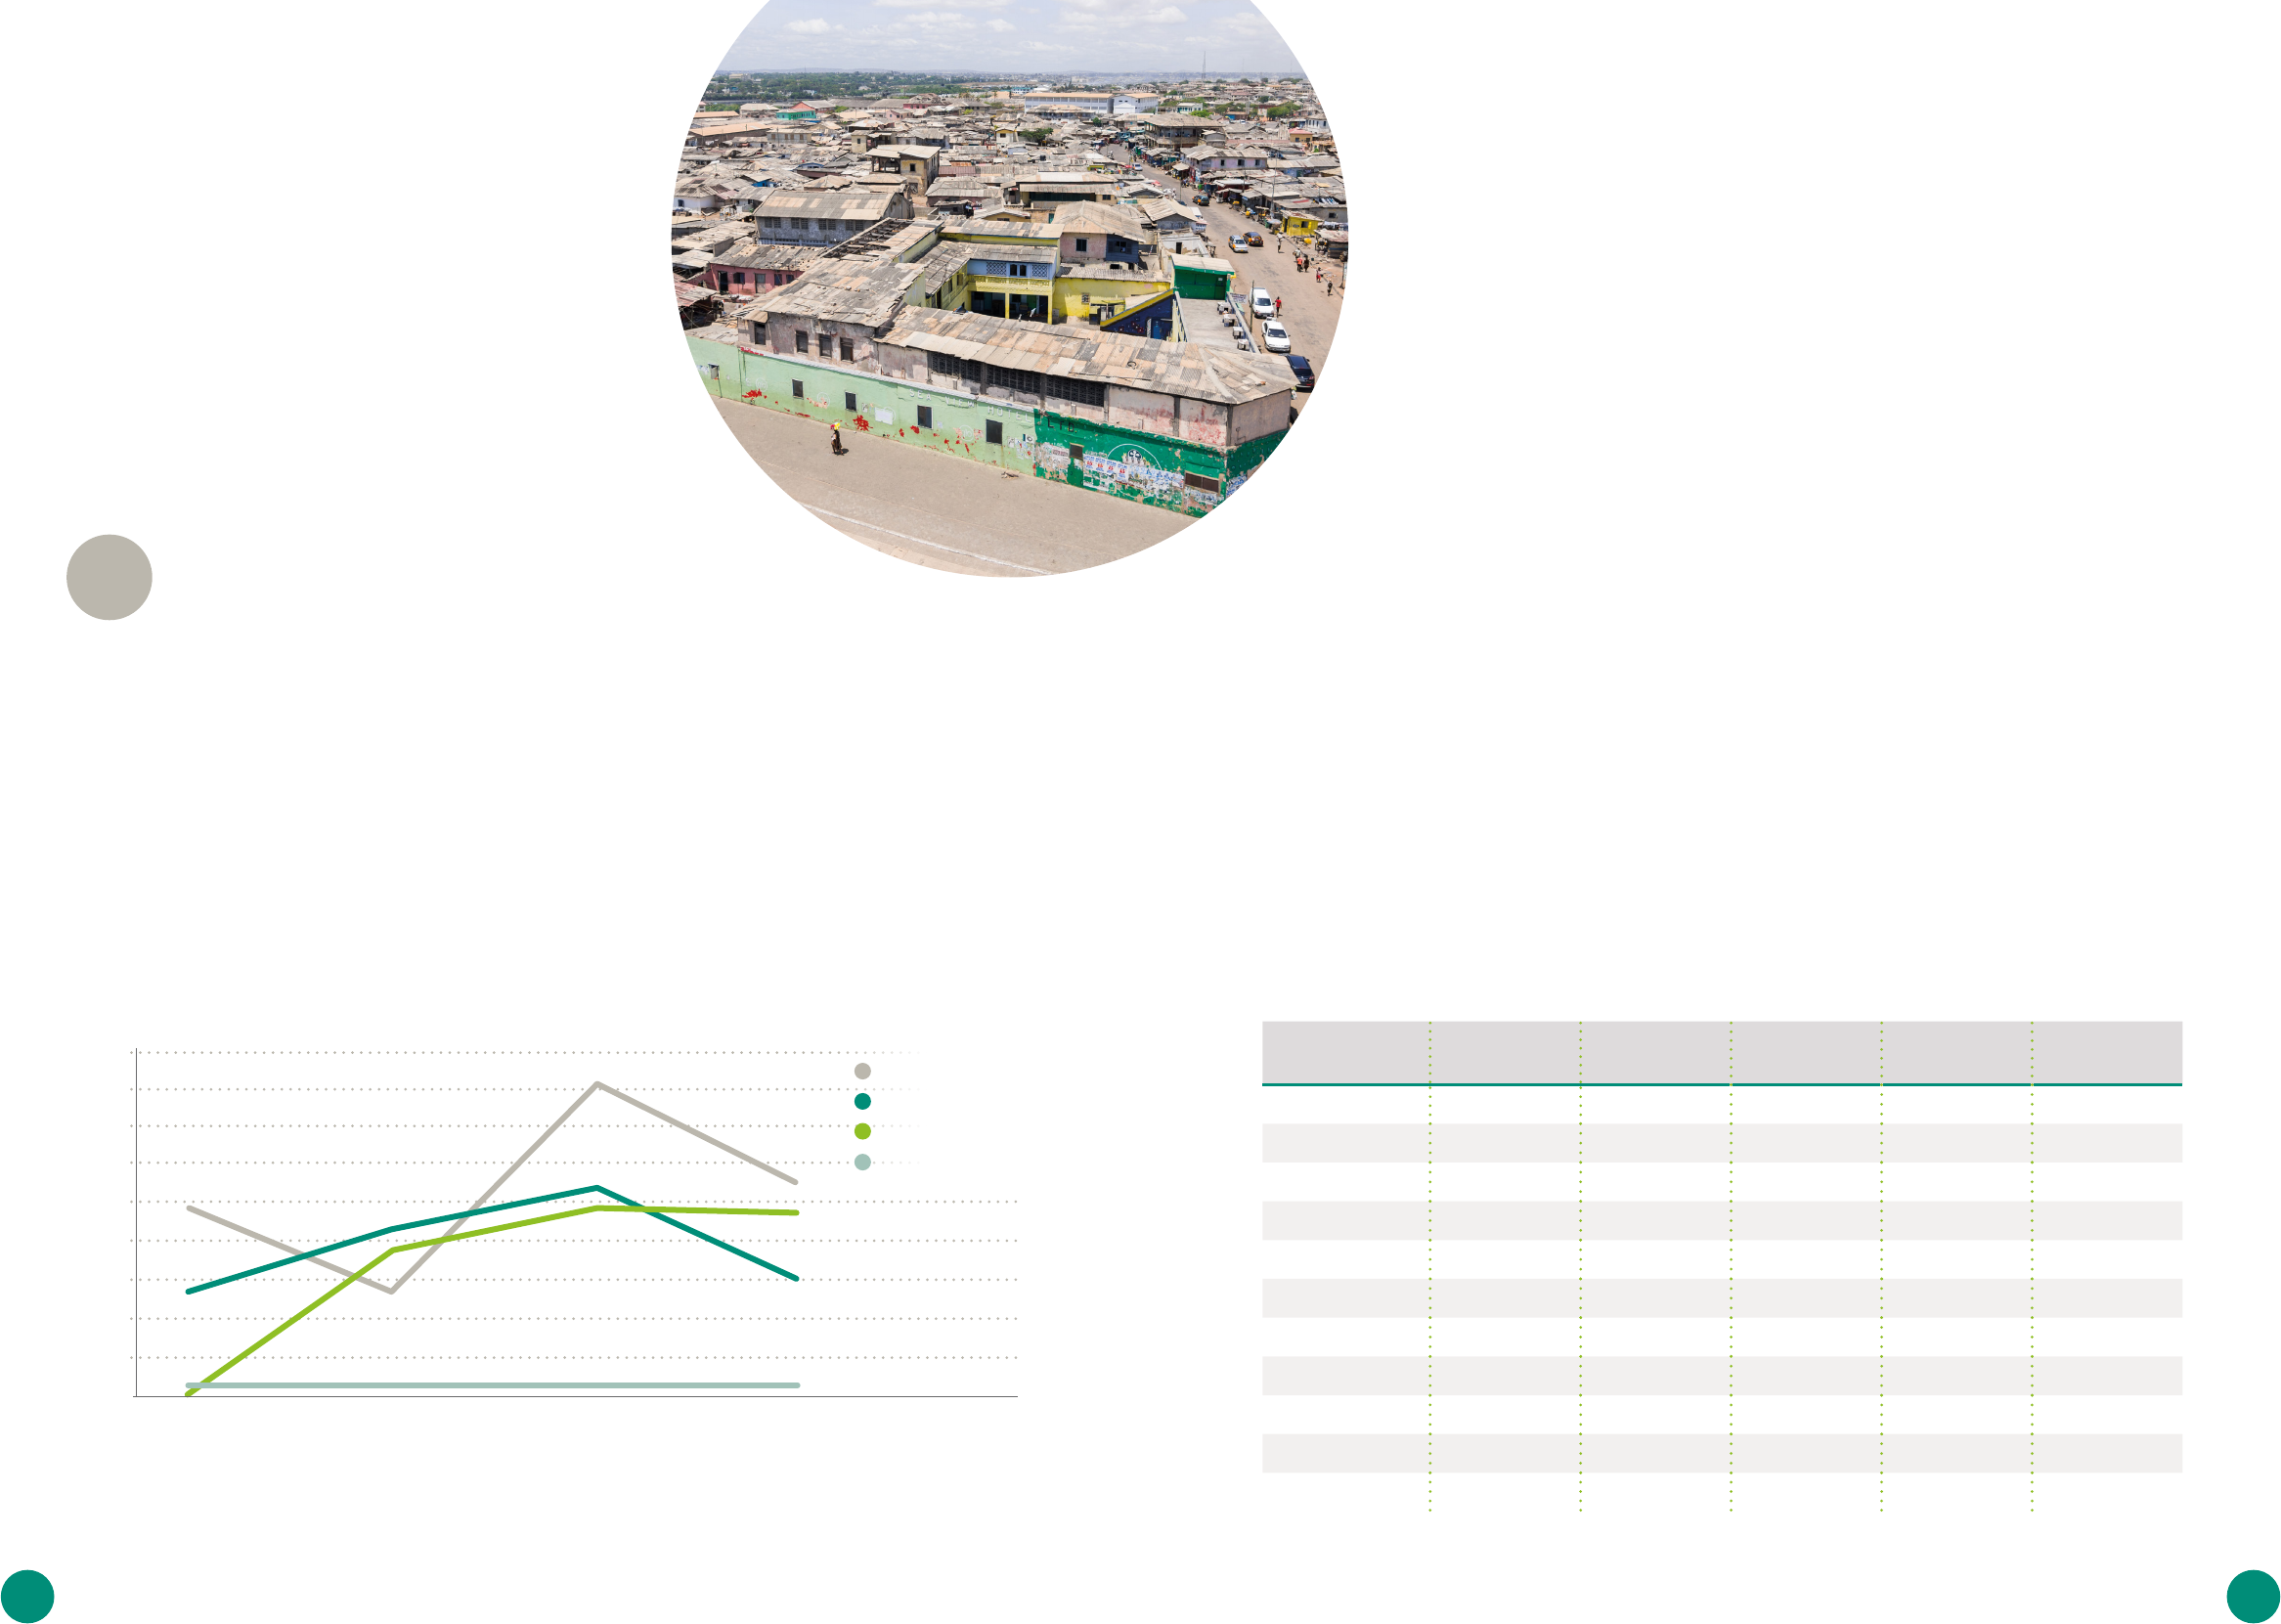
F
igure 1 shows that both the population and
the number of households increased bet-
ween 1960 to 2000. After the turn of the mill-
ennium, the rate of population growth witnessed a
decline while the number of households continued
to increase – albeit at a slower pace, which there-
fore suggests the beginnings of a decline by 2010.
The increasing formation of new households con-
forms with the shrinking household sizes observed
over the censual years. Household sizes peaked
in 2000 at 5.1 persons per household and subse-
quently declined to 4.4 persons per household in
2010. If this reduction in household size continues
without a corresponding significant slowdown in
population growth, and unless the current pace
of housebuilding is ramped up, the demand for
housing will remain high.
The housing situation differs greatly between the
regions in the north of the country and those in
the south, which perhaps reflects the development
gap existing between these two zones. Northern
regions have higher household sizes and less
housing stock compared to southern regions. Si-
milarly, there are more multifamily living arrange-
ments in the south than in the north of the coun-
try (with the exception of the Upper East region),
the south having about 50% more households per
house (see Table 1 below).
REGION
NUMBER OF
HOUSES
NUMBER OF
HOUSEHOLDS
RURAL SHARE
OF HOUSING
STOCK
HOUSEHOLDS
PER HOUSE
AVERAGE
HOUSEHOLD
SIZE
ALL REGIONS
3,392,745 5,467,136 57.7 1.6 4.4
ASHANTI
574,066 1,126,216 53.0 2.0 4.1
GREATER ACCRA
474,621 1,036,426 13.0 2.2 3.8
EASTERN
431,697 632,048 64.1 1.5 4.1
VOLTA
399,953 495,603 72.2 1.2 4.2
WESTERN
380,104 553,635 67.5 1.5 4.2
CENTRAL
346,699 526,764 61.8 1.5 4.0
BRONG-AHAFO
331,967 490,519 63.4 1.5 4.6
NORTHERN
257,311 318,119 71.3 1.2 7.7
UPPER EAST
114,034 177,631 79.2 1.6 5.8
UPPER WEST
82,293 110,175 85.4 1.3 6.2
Table 1 • EXISTING HOUSING STOCK AND HOUSEHOLDS IN 2010
Figure 1 • PERCENTAGE CHANGES IN DEMOGRAPHICS AND HOUSING STOCK
GSS 2014.
8
%
20
30
40
50
10
0
60
70
80
90
Increase in households
Population growth rate
Increase in population
Increase in housinng stock
1960-70 1970-84 1984-2000 2000-2010
Photo: VanWyckExpress/istockphoto.com
1514
T
he most common housing typology found
throughout Ghana is the compound house,
which accommodates multiple households
in a shared building. The data from the population
and housing censuses (2000 and 2010) and the
Ghana Living Standards Surveys (GLSS) (2008 and
2014)
9
show that, compared to the other housing
typologies, the share of compound housing in-
creased from 50% to nearly 70% between 2000 and
2010 (see Table 2 in which compound housing is
highlighted). This finding calls into question the
generally held notion that households, and parti-
cularly those in urban locations, prefer detached
bungalows. On the contrary, it would seem that
people’s housing preferences are flexible when it
comes to the country’s housing stock. This trend
in sharing housing arrangements applies to both
urban and rural areas.
I
n general, the types of materials used to build
houses can help in determining whether the
properties potentially fall into the affordable
housing category. This category applies to housing
built with materials that fall below the minimum
standards stipulated in the national building re-
gulations (LI 1630) and are thus unable to protect
inhabitants from a range of hazards such as harsh
weather conditions. The building regulations deem
housing walls constructed with ‘temporary ma-
terials’ such as metal sheets, wood, thatch and
palm leaves to be sub-standard. Often, this kind of
housing is occupied by people on low incomes.
Table 3 below provides an overview of housing in
Ghana based on the types of building materials
used. However, this is not a strong measure as it
does not give any idea of the present condition of
the properties.
In rural areas, where 73% of rural households live
in dwellings built mainly with mud, housing issues
centre more on questions of quality rather than
quantity (GSS 2008). In contrast, the use of sand-
crete is more common in urban areas (see table 3
in which this highlighted in yellow). Even though
this is a singular proxy indication of housing qua-
lity, it reflects expenditure patterns on housing, as
urban dwellers spend on average 118% more on
housing than their rural counterparts. However, this
is not to insinuate that issues of housing quality
are specific to rural areas. On the contrary, 42.8% of
urban dwellers live in slums (UN-HABITAT, 2014).
Although landcrete, burnt bricks and bamboo are
proven building materials and their source materi-
als are readily available locally, their use is mainly
confined to wall building in both rural and urban zo-
nes. Sandcrete and concrete walling dominates the
urban landscape whereas earthen material walling
is commonest in rural areas. A transition away from
earthen materials towards concrete and sandcrete
use has, however, been observed in rural areas.
TRENDS IN TYPES OF HOUSING (2000 TO 2014) HOUSING MATERIALS (EXTERNAL WALLING)
ACCRA (GAMA) OTHER URBAN ALL URBAN ALL RURAL
TYPE OF
DWELLING
GLSS 5
2008
GLSS 6
2014
GLSS 5
2008
GLSS 6
2014
PHC
2000
GLSS 5
2008
PHC
2010
GLSS 6
2014
GLSS 5 PHC
2010
GLSS 6
2014
SEPARATE HOUSE
8,5 14,9 4,8 14,1 16,0 6,0 19,3 14,3 2,4 40,1 16,4
SEMI-DETACHED
HOUSE
6,8 6,4 3,4 5,9 14,9 4,5 7,8 6,1 2,7 6,3 8,2
FLAT/APARTMENT
8,9 7,4 4,5 4,6 7,2 5,9 7,0 5,5 0,8 1,9 1,3
COMPOUND HOUSE
(ROOMS)
53,9 63,9 55,5 70,0 51,6 55,0 58,7 68,1 35,1 42,9 51,3
SEVERAL HUTS/
BUILDINGS
2,6 0,7 2,9 4,0 2,5 2,7 1,0 3,0 9,5 5,7 21,7
TENTS/IMPROVISED
HOME (KIOSK,
CONTAINER, ETC.)
2,3 3,7 0,1 0,4 0,1 0,8 0,3 1,5 0,2 0,2 0,1
LIVING QUARTERS
ATTACHED TO
OFFICE/SHOP
— 0,6 — 0,2 0,6 — — 0,3 — — 0,2
UNCOMPLETED
BUILDING
— 2,4 — 0,6 4,3 — 2,1 1,2 — 1,0 0,2
OTHERS
1,4 0,1 0,1 0,2 4,3 0,5 — 0,2 0,2 — 0,7
Source: compiled using data from GSS (2000, 2008, 2010 and 2014).
Table 2 • TRENDS IN HOUSING TYPOLOGY IN GHANA
MAIN MATERIALS
USED FOR EXTER-
NAL WALLING
10
ACCRA (GAMA) OTHER URBAN ALL URBAN ALL RURAL
GLSS 5
2008
GLSS 6
2014
GLSS 5
2008
GLSS 6
2014
PHC
2000
GLSS 5
2008
PHC
2010
GLSS 6
2014
PHC
2000
GLSS 5
2008
PHC
2010
GLSS 6
2014
MUD/MUD
BRICKS/EARTH
2,3 0,6 26,5 15,0 21,5 18,5 12,4 10,4 74,5 72,9 60,5 56,9
WOOD
7,5 6,5 0,5 0,6 5,4 2,8 4,8 2,5 2,7 1,0 1,8 0,7
METAL/SHEET/
SLATE/ASBESTOS
0,5 1,0 0,1 1,0 0,9 0,2 1,0 1,0 0,3 0,1 0,5 0,5
STONE
0,2 0,2 0,5 - 0,3 0,4 0,2 0,1 0,2 0,3 0,2 0,1
BURNT BRICKS
0,3 0,1 0,8 0,4 2,0 0,6 0,7 0,3 1,1 0,6 0,6 1,3
CEMENT BLOCKS/
CONCRETE
88,4 91,5 69,4 82,5 65,3 75,7 78,5 85,3 16,6 21,8 32,1 39,7
LANDCRETE
— — — 0,4 2,9 — 1,2 0,3 2,6 3,1 2,5 0,3
BAMBOO/PALM
LEAVES/THATCH
(GRASS/RAFFIA/
OTHERS)
— 0,1 — 0,1 1,6 — 1,3 0,1 2,0 0,1 1,7 0,5
Source: compiled using data from GSS (2000, 2008, 2010 and 2014).
Table 3 • SUMMARY OF THE MAIN MATERIALS USED FOR EXTERNAL WALLING
1716
T
he level of overcrowding in Ghana’s
housing, both in urban and rural areas, is
increasingly becoming a concern. Half of
the country’s total number of households dwell
in single rooms, making single-room occupancy
the commonest occupancy type, and over 75% of
households occupy either one or two rooms (see
the green-shaded rows in Tables 4 and 5). Given
the average household size in Ghana stands at 4.4
persons, it can be inferred that single- and dou-
ble-room dwellings suffer moderate to significant
levels of overcrowding.
The situation is more acute when one considers
occupancy in terms of sleeping rooms. The 2010
PHC acknowledges differences between room
occupancy per household and sleeping-room
occupancy per household, with the latter recording
much higher figures. Some households have two
or more rooms but only use one for sleeping. The
second room usually serves as the living room
and/or kitchen.
The analysis of the number of rooms occupied
compared to the size of the household reflects the
increasing pressure on the existing housing stock.
HOUSING TYPES BY OCCUPANCY
PROPORTION
OF ROOMS
OCCUPIED PER
HOUSEHOLD
ACCRA (GAMA) OTHER URBAN ALL URBAN ALL RURAL
PHC
2000
GLSS 5
2008
GLSS 6
2014
GLSS 5
2008
GLSS 6
2014
PHC
2000
GLSS 5
2008
PHC
2010
GLSS 6
2014
PHC
2000
GLSS 5
2008
PHC
2010
GLSS 6
2014
ONE ROOM
45,2 53,6 42,7 60,6 58,5 47,5 58,3 51,4 53,5 29,5 51,9 35,9 49,9
TWO ROOMS
33,2 30,8 35,4 22,8 22,4 24,0 25,5 24,6 26,5 23,7 26,2 25,1 26,7
THREE ROOMS
6,7 8,3 9,0 8,7 9,1 8,9 8,6 9,1 9,1 15,4 12,5 14,7 10,7
FOUR ROOMS
5,5 3,0 6,4 4,3 5,0 6,0 3,8 5,6 5,5 9,9 4,7 9,0 6,1
FIVE ROOMS
4,0 4,3 6,5 3,6 5,0 4,3 3,8 3,3 5,5 6,7 4,7 5,6 6,6
SIX ROOMS
1,9 4,3 6,5 3,6 5,0 2,7 3,8 2,2 5,5 4,6 4,7 3,3 6,6
SEVEN ROOMS
1,1 4,3 6,5 3,6 5,0 1,7 3,8 1,4 5,5 3,0 4,7 2,2 6,6
EIGHT ROOMS
0,8 4,3 6,5 3,6 5,0 1,3 3,8 0,8 5,5 2,2 4,7 1,6 6,6
NINE OR MORE
ROOMS
1,6 4,3 6,5 3,6 5,0 3,6 3,8 1,4 5,5 5,0 4,7 0,9 6,6
Source: compiled using data from GSS (2000, 2008, 2010 and 2014).
Table 4 • ROOM OCCUPANCY IN DIFFERENT LOCALITIES
PROPORTION OF
SLEEPING ROOMS
OCCUPIED PER
HOUSEHOLD
11
URBAN RURAL
PHC 2000 PHC 2010 PHC 2000 PHC 2010
ONE ROOM
61,9 61,4 39,1 45,5
TWO ROOMS
17,5 22,2 25 26,9
THREE ROOMS
7,6 7,8 14,5 13,1
FOUR ROOMS
4,6 4,2 8,3 6,8
FIVE ROOMS
2,6 2 4,6 3,2
SIX ROOMS
1,7 1,1 3,1 1,9
SEVEN ROOMS
1 0,5 1,8 0,9
EIGHT ROOMS
0,8 0,6 1,2 0,6
NINE OR MORE
ROOMS
2,3 0 2,4 1
Source: compiled using data from GSS (2000 and 2010).
Table 5 • SLEEPING ROOMS PER HOUSEHOLD IN VARIOUS LOCALITIES
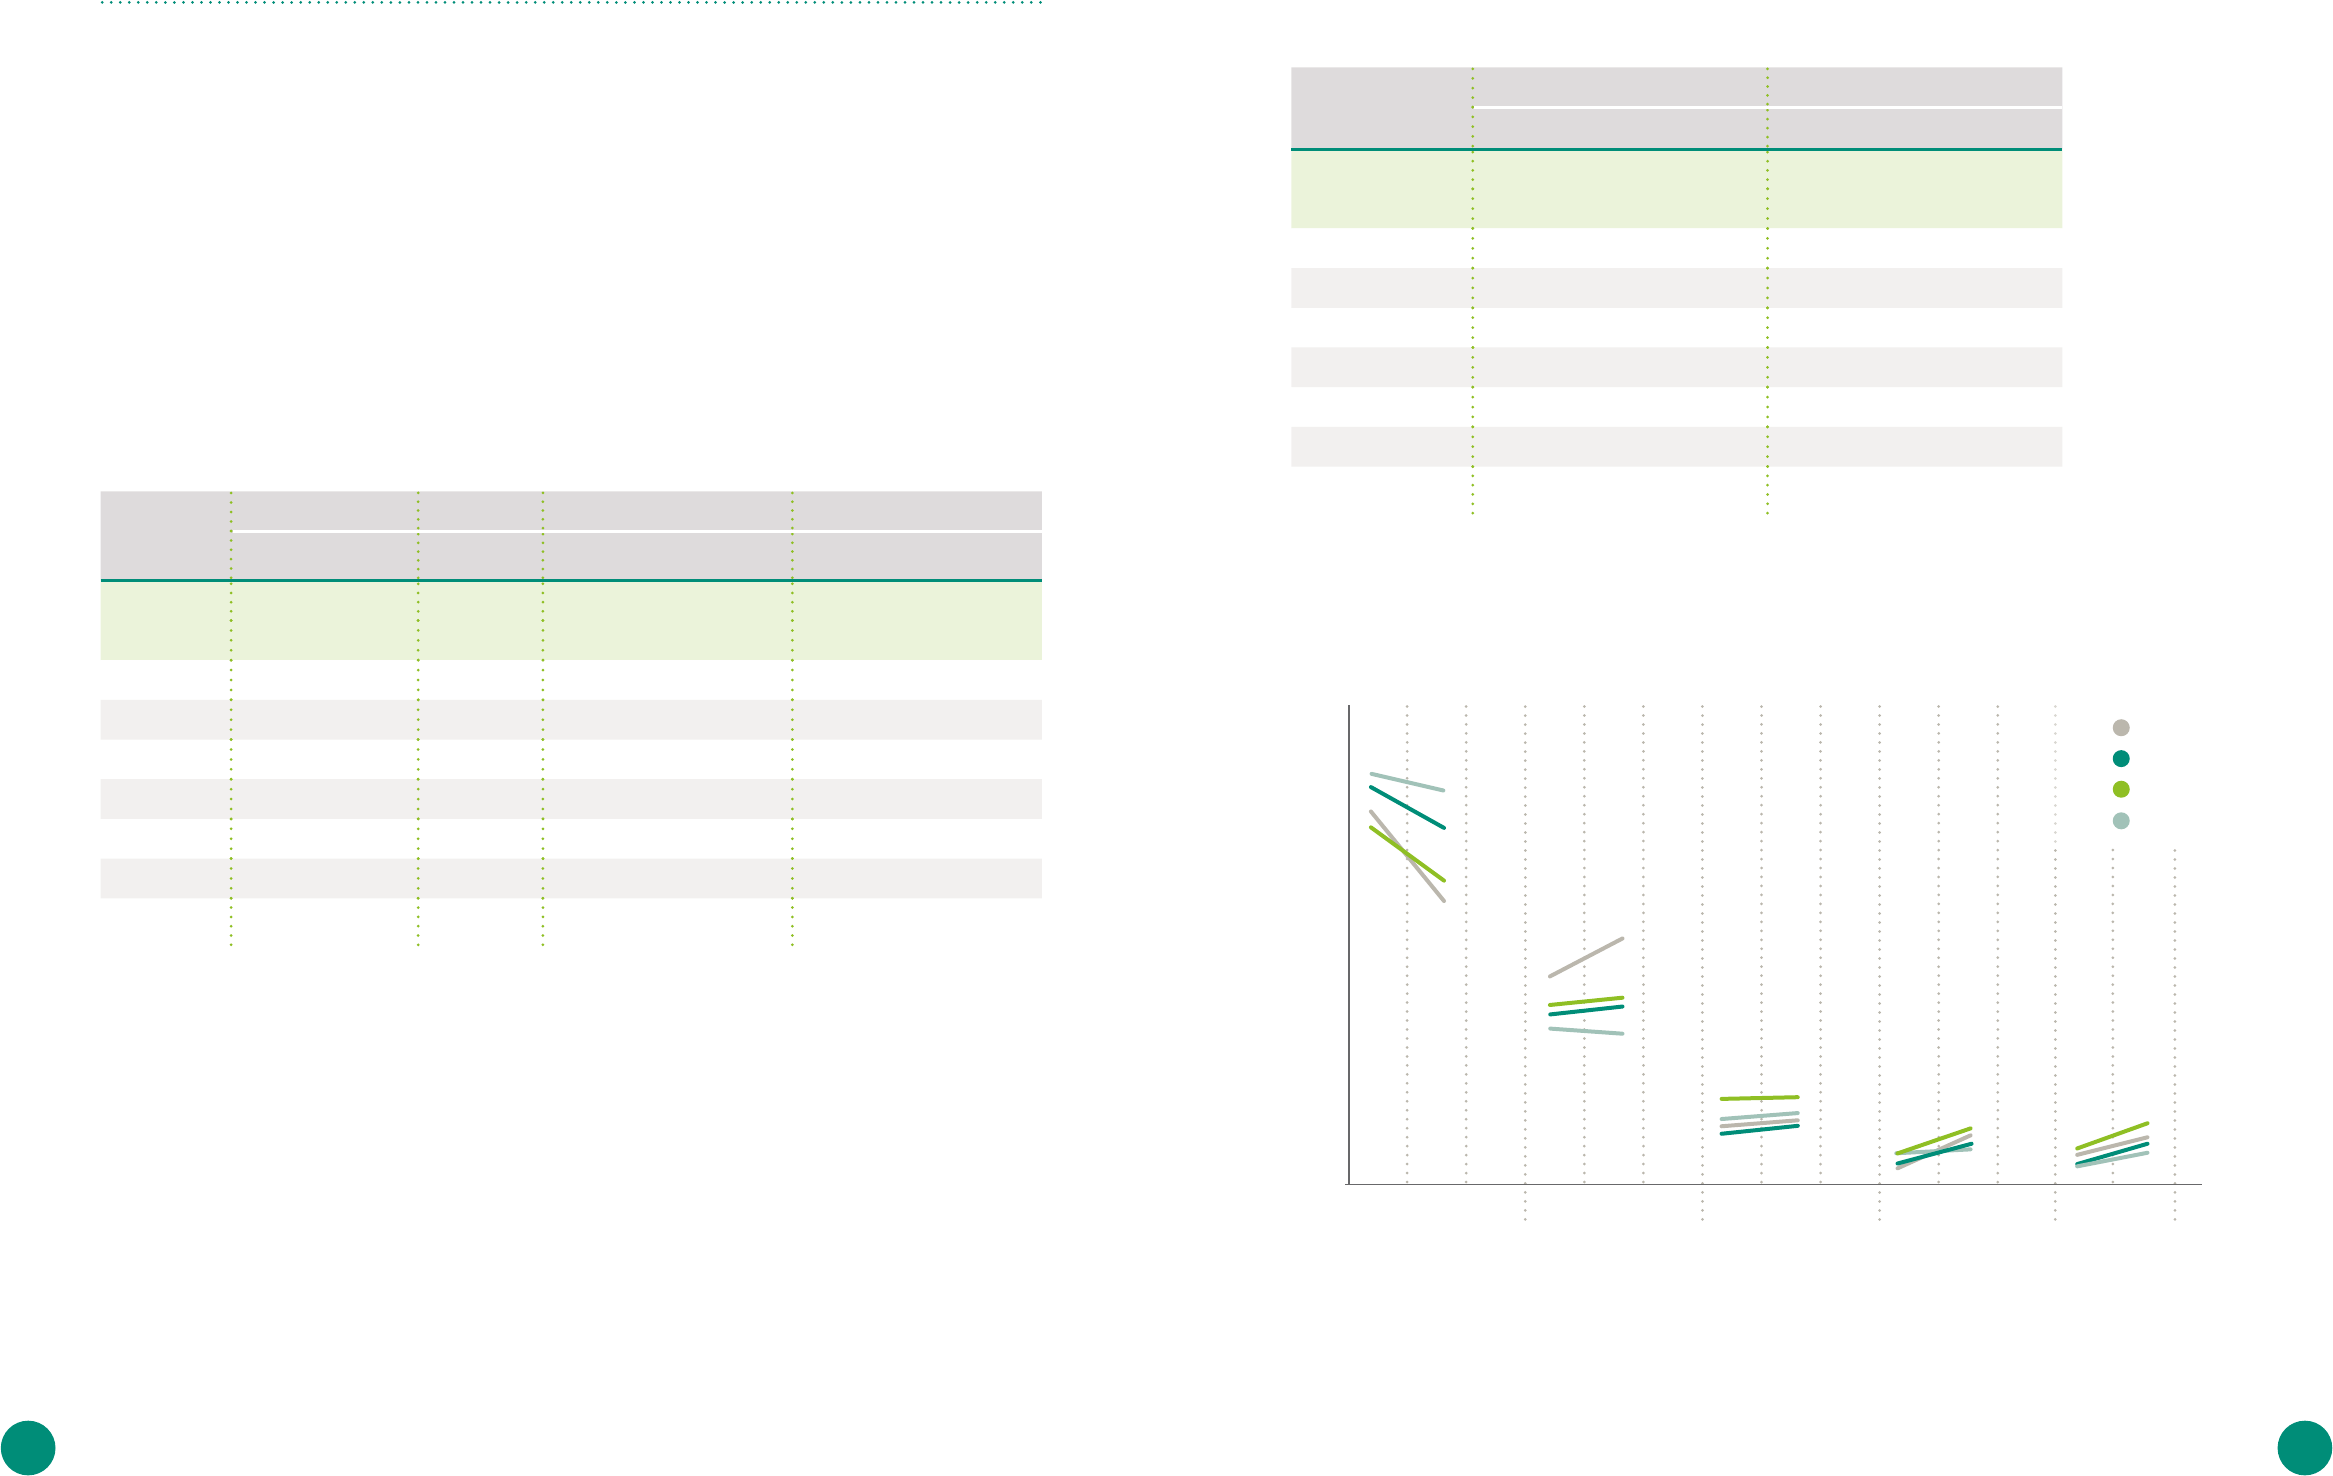
Source: produced by the authors using data from GSS (2008 and 2014).
Figure 2 • ROOMS OCCUPIED BY HOUSEHOLDS IN URBAN AND RURAL AREAS 2008 TO 2014
%
10
20
30
40
50
60
0
70
All rural
Other urban
All urban
GAMA
2008-2014
1 ROOM 2 ROOMS 3 ROOMS 4 ROOMS 5+ ROOMS
2008-2014 2008-2014 2008-2014 2008-2014
1918
T
he overview of housing tenure in Ghana is
quite revealing, with urban and rural areas
displaying marked differences. Whereas
two-thirds of households own their homes in rural
areas, only a third do in urban areas. Urban areas
have more renters (one-third) than rural areas
(one-tenth). A third tenure type, not uncommon in
Ghanaian society, is rent-free status, which cons-
titutes around a quarter of households’ tenure in
both urban and rural areas. The share of housing
owned by relatives (33%) relates strongly with the
proportion of households with rent-free tenure
(27%). The higher ratio of rural households living in
dwellings owed by relatives (60%) reflects the ‘fa-
mily housing’ context whereby the extended family
is able to secure a cohabitation arrangement on
the basis of filial relationships and family patriar-
chal ties.
It is reasonable to assume that a large segment
of the households in need of affordable housing
interventions are those that are presently in rent-
free accommodation or are perching or squatting.
On the basis of this assumption, it is possible to
deduce that in 2010, 27% of households required
affordable housing solutions.
HOUSING TENURE
HOUSING
UNITS BY
TENURE TYPE
AND LOCALITY
ACCRA (GAMA) OTHER URBAN ALL URBAN ALL RURAL
PHC
2000
GLSS 5
2008
GLSS 6
2014
PHC
2000
GLSS 5
2008
GLSS 6
2014
PHC
2000
GLSS 5
2008
PHC
2010
GLSS 6
2014
PHC
2000
GLSS 5
2008
PHC
2010
GLSS 6
2014
OWNING
38.2 26.6 35.2 41.4 25.8 31.7 41.4 26.1 32.7 32.8 71.7 58.7 65.5 62.1
RENTING
40.7 45.9 41.0 35.8 38.5 39.3 35.8 40.9 45.0 39.9 9.9 9.1 13.5 10.7
RENT-FREE
19.9 24.8 23.1 21.6 35.1 28.6 21.6 31.7 21.2 26.8 17.6 32.0 20.3 27.0
PERCHING
12
1.2 2.7 0.5 1.2 0.6 0.2 1.2 1.3 0.5 0.3 0.8 0.3 0.4 0.2
SQUATTING
— — 0.3 — — 0.2 — — 0.4 0.2 — — 0.1 0.1
Source: compiled using data from GSS (2008 and 2014).
Table 6 • HOUSING TENURE
E
stimates of the housing deficit in Ghana vary
widely, due in part to confusion arising from
what defines and how to distinguish between
a house and a dwelling unit. Another factor is the
difficulty in determining the quantity of housing
supplied through informally self-managed pro-
cesses. The data in Table 7 below exemplifies this
uncertainty regarding overall housing needs and
unmet demand.
ESTIMATED MARKET VOLUME FOR AFFORDABLE HOUSING
IN GHANA
Source: compiled using data from the UN-HABITAT (2011), the Ministry
of Water Resources, Works and Housing (2015) and GSS (2005).
SOURCE TOTAL HOUSING STOCK ANNUAL SUPPLY DEFICIT/NEED ANNUAL NEED
GOVERNMENT OF
GHANA (1987)
— — — 101,800
13
AMOA-MENSAH (2003)
— 37,000 — 90,000
UN-HABITAT (2004)
2,181,975 — — 1,010,000 by 2010
GHANA STATISTICAL
SERVICE (2005)
2,181,797 — —
138,085 units per annum;
3,500,000 by 2025
MAHAMA AND ANTWI
(2006)
— 25,000
300,000,
1,200,000 by 2005
130,000
ASIAMAH (2006)
— — 800,000 —
BANK OF GHANA (2007)
2,181,975 —
1,500,000 in 2000 with an
additional 665,000 by 2010
—
KARLEY (2008)
2,200,000 25,000–40,000 500,000 70,000
UN-HABITAT (2010)
— 250,000 — 133,000
GOVERNMENT OF
GHANA (2015)
3,392,745 —
4,000,000 rooms between
2000 and 2010; 5,700,000
rooms by 2020.
—
Table 7 • ESTIMATED HOUSING NEED
2120
What is clear is that housing supply has fallen far
behind housing needs over the years. The esti-
mated current annual deficit ranges from 106,806
to 170,751 units.
14
Assuming the upper estimates
hold true, the country will have an aggregate
deficit of 7.2 million rooms by 2020 (MWRWH 2015).
A substantial proportion of this deficit will be in
affordable housing, which is needed in some cases
to reduce crowding – due to rent-free status or
less than adequate dwellings – and in others to
replace dilapidated buildings.
Another way of estimating the affordable housing
market is to extrapolate from expenditure on
housing
15
, assuming that those in the lowest two
income quintiles are in need of affordable housing.
Table 9 shows that there has been substantial
growth in housing expenditure, although a large
gap exists between urban and rural households:
of the total of GHS 814 million spent on housing
in 2008, GHS 575 million was spent in urban areas
and about half of that was spent in rural areas. By
2014 the total spend on housing had grown to GHS
5.997 billion, of which GHS 4.6 billion was spent in
urban areas. As such, spending on housing in rural
areas was only one third of that in urban areas.
Housing expenditure as a share of total household
expenditure grew threefold between 2008 and
2014, with housing now constituting 11% of house-
hold expenditure for the lowest two quintiles and
rising marginally to 13% for the highest income
quintile.
Using the proportion of expenditure spent on
housing to calculate how much potential income is
available to those investing in affordable housing
provides a total figure of GHS 1.2 billion, an equiva-
lent of USD 536 million (as at 31 December 2013).
The estimate includes spending on housing con-
struction, the extension of existing buildings, and
rent, maintenance and utility payments. It excludes
outgoings for furnishings, fixtures and fittings, and
other consumables associated with the occupation
of the housing. Considered together, the estimated
existing housing deficit and level of expenditure on
housing serve to highlight the huge and untapped
opportunities awaiting the private sector.
Even though there has been a boom in housing
construction, investments have mainly targeted
high-income, low-risk borrowers. The amount of
investment is significant, with mortgages worth a
total of USD 180 million taken out as at 2013 (Adu
2014). However, the impact of these new-builds on
the overall housing stock has not been as signifi-
cant as the combined output of individual midd-
le- to low-income households whose incremental
approaches to building have dominated total
housing supply (Boamah 2014).
Based on the average household incomes reported
in the GLSS 6 (indexed to 2016), households can
afford USD 14,000 at house cost: income(HC:Y) ratio
of 3. If they can manage to spend more on housing,
at an HC:Y of 5, they could reach up to USD 23,000.
Table 12 shows that, in rural areas, households can
afford to spend USD 9,000 at an HC:Y of 3 on either
renting or purchasing housing. Rising inflation and
the persistently falling value of the Ghanaian Cedi
(GHS) reduce how much households are able to
spend on housing.
Item Figures
Total number of households
6,601,500
Households forming quintiles 1 and 2
2,640,600
Annual household expenditure by those in quintile 1
GHS 347.7
Annual household expenditure by those in quintile 2
GHS530
Proportion of housing expenditure for quintiles 1 and 2 in 2014
19.5%
Total amount spent by quintiles 1 and 2 on housing
GHS 1,158,827,310
Source: compiled using data from the GSS (2014).
Table 9 • VALUE OF THE AFFORDABLE HOUSING MARKET
Source: GSS (2005), and Population Data Analysis Reports, Vol. 2, p. 58, Table 1.57.
PROJECTED
INDICATORS
2000 2005 2010 2015 2020 2025 INCREASE
TOTAL POPULATION
18,912,079 21,134,500
23,458,808
(24,658,823)
25,950,150 28,511,828 31,311,432 —
HOUSEHOLD POPULA-
TION (98.7% OF TOTAL
POPULATION)
18,666,222 20,859,752 23,153,843 25,612,798 28,141,174 30,904,383 —
ASSUMED HOUSE-
HOLD SIZE
5.1 5.2
5.2
(4.4)
5.2 5.2 5.2 —
PROJECTED HOUSING
NEED
3,660,044 4,011,491 4,452,662 4,925,538 5,411,764 5,943,151 —
ACTUAL HOUSES
NEEDED (1.7 HOUSE-
HOLDS/ HOUSE)
2,152,967 2,359,700 2,619,213 2,897,375 3,183,390 3,459,971 —
INCREASED NEW
HOUSING NEED
— 206,733 259,513 278,162 286,015 312,581 1,343,004
DILAPIDATED HOUSES
— 327,296 353,955 392,882 492,554 541,176 2,107,863
TOTAL ADDITIONAL
HOUSING NEEDED
— 534,029 613,468 671,044 778,569 853,757 3,450,867
PERCENT INCREASE
— 24.8 26.0 25.6 26.9 26.8 60.3
Table 8 • ANALYSIS OF HOUSING NEED 2000 TO 2025
2322
AFFORDABILITY IN USD
18
GAMA OTHER URBAN ALL URBAN ALL RURAL
AT HC:Y RATIO OF 3
13,672.23 18,252.52 16,809.52 9,162.10
AT HC:Y RATIO OF 4
18,229.64 24,336.69 22,412.70 12,216.13
AT HC:Y RATIO OF 5
22,787.05 30,420.86 28,015.87 15,270.17
Source: compiled using data from UN-HABITAT (2011).
Table 12 • AFFORDABILITY DETERMINED USING MEAN HOUSEHOLD
INCOME IDENTIFIED IN GLSS 6, INDEXED TO 2016
Source: UN-HABITAT, 2011
19
.
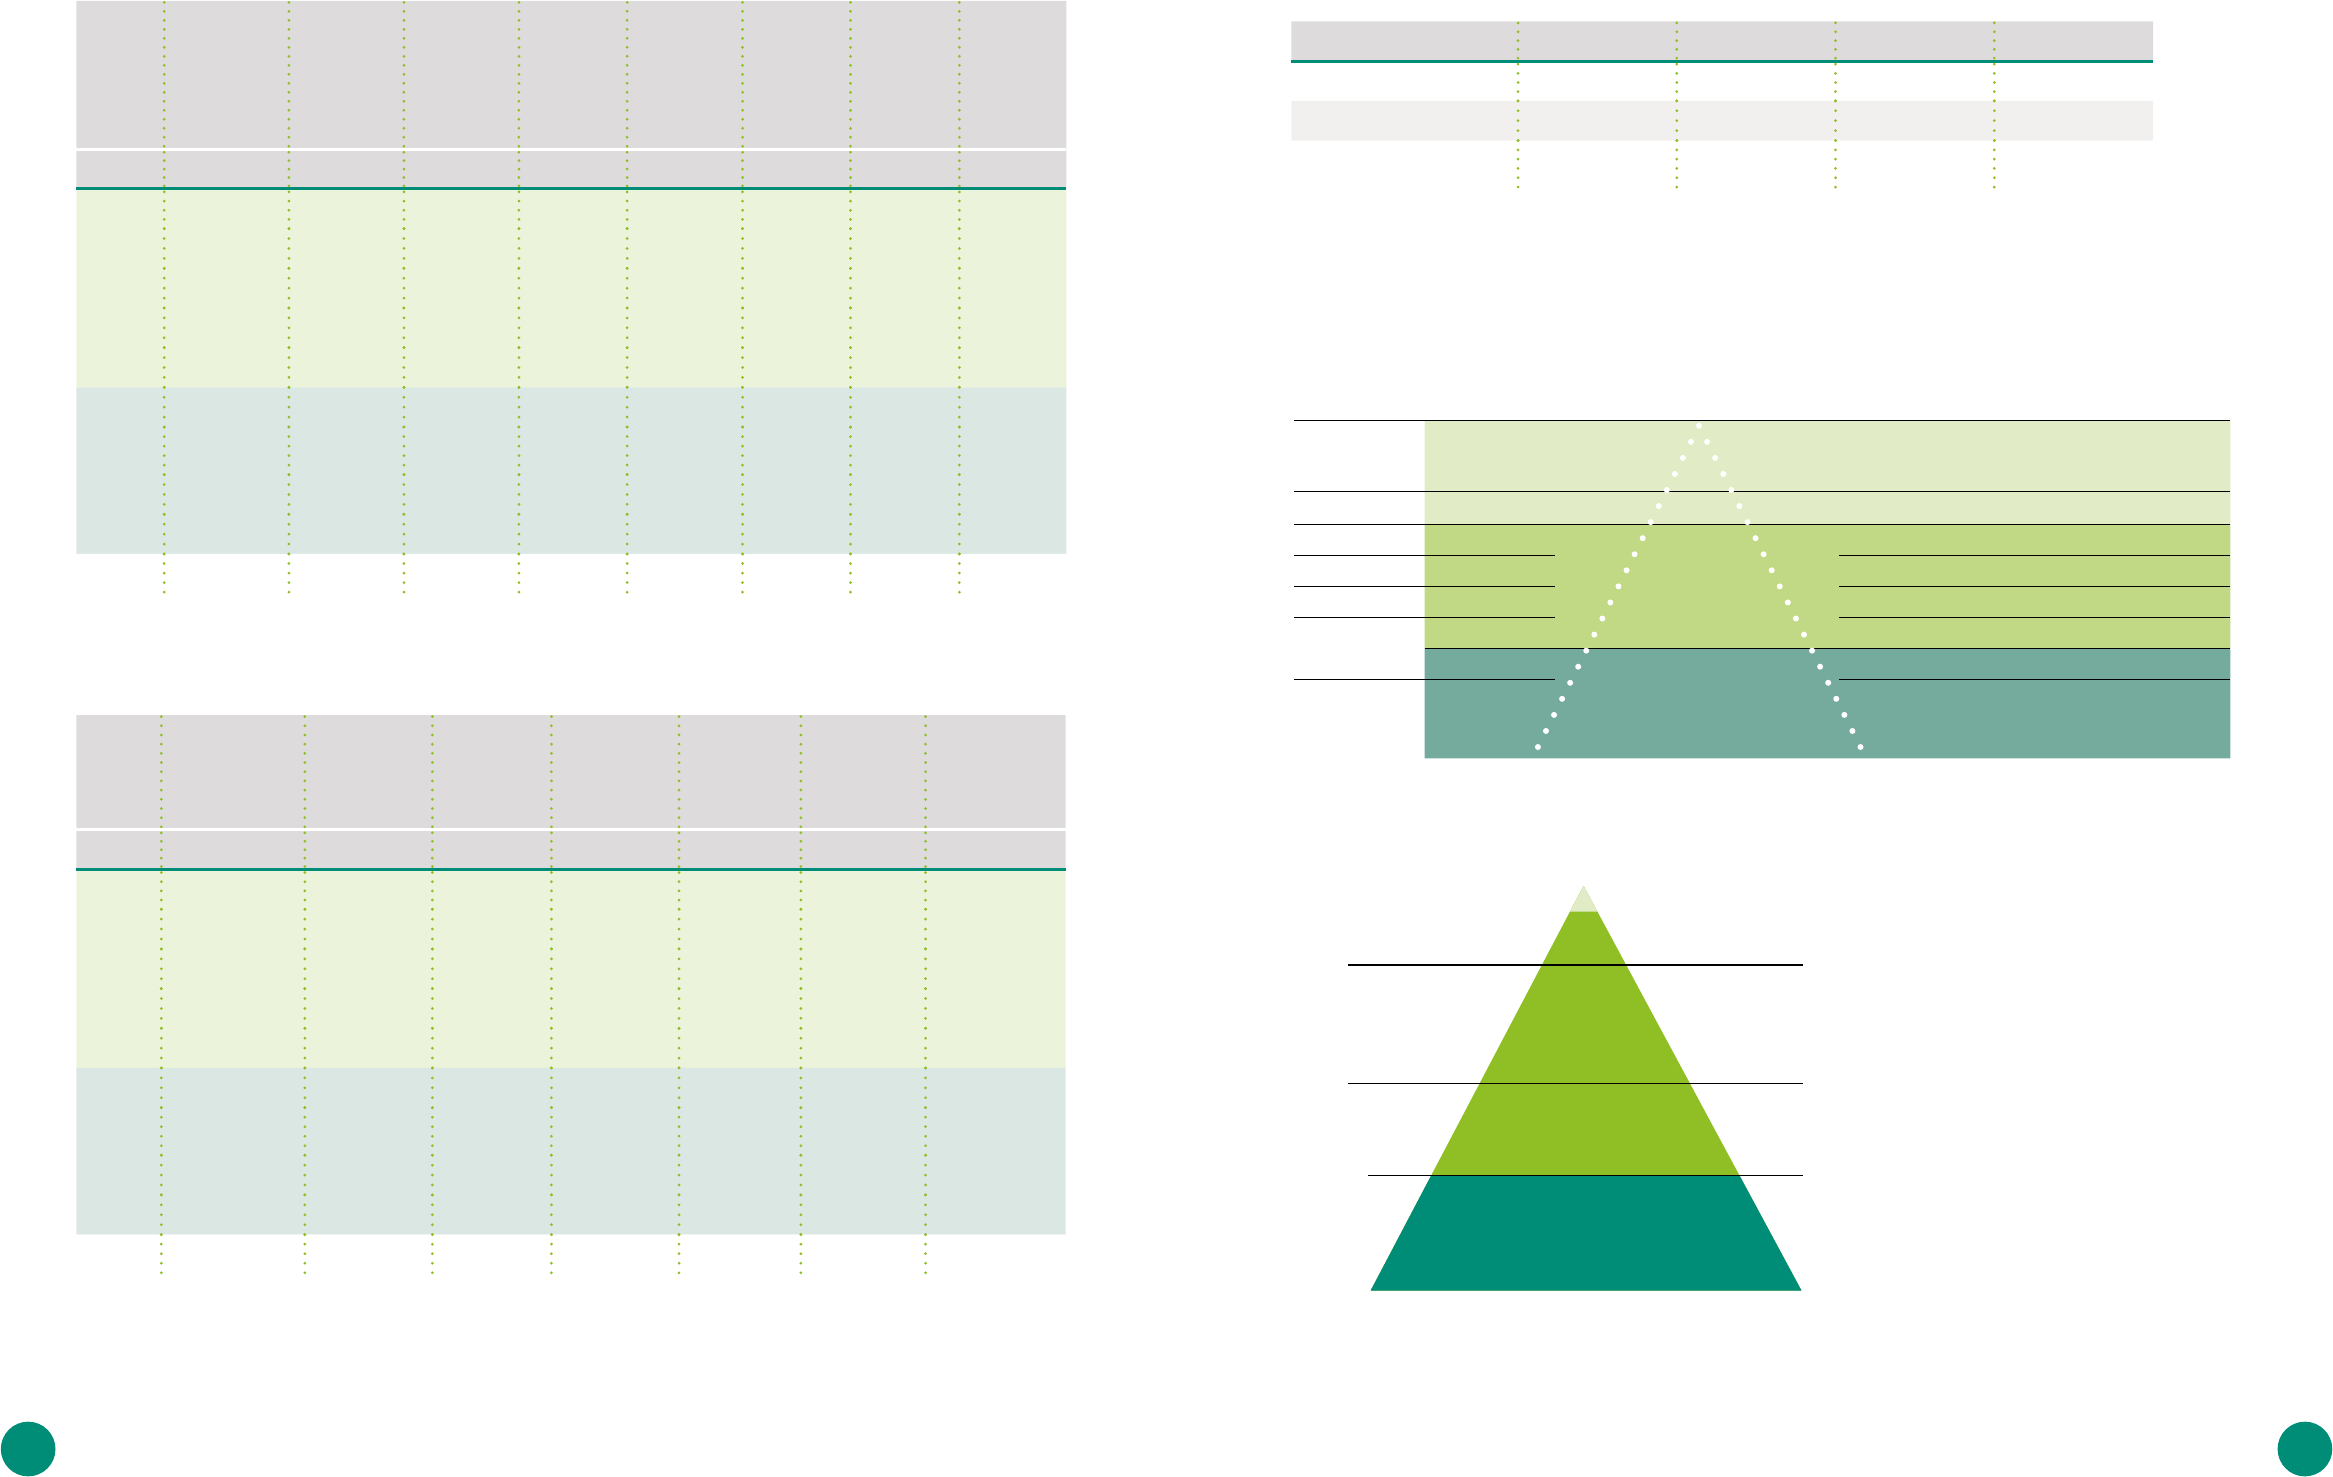
Figure 3 • HOUSING AFFORDABILITY PYRAMID
Income
Range
Income
GHC/month
Percentage of all
Households
Maximum
affordability
(in GHC) assu-
mining 3 times
annual income
Housing cost
(GHC) aimed at
the thresholds
Monthly
maximum rent
levels (GHC)
affordable at
R:Y of 10%
Very High >4,000
5%
180,000 476,000 &
204,000
500 +
High 3,001–4,000
10%
144,000 163,200 400
Mid-high 2,001–3,000
50%
of households
can afford housing
costing between
GHC12,001 and GHC72,000
108,000 95,200 300
Middle 1001–2,000 72,000 Up to 54,000 200
Moderate 501–1,000 36,000 100
Low income 101–500 18,000 50
51–100
35%
of households can
afford housing costing
GHC12,000 or less
12,000 10
No wage
income
0–50
Source: CAHF 2013.
Figure 4 • HOUSING AFFORDABILITY IN GHANA
The cheapest newly built house for sale is
$25 000. A buyer would have to put down
a $2500 deposit and earn $970/month to
afford a 20 year mortgage (US dollar deno-
minated) at 13,5%.
About 90% og Ghana's housing stock has
been produced through self-build. A sizeab-
le middel class suggests opportunities for
microfinance. These are being explored by
Habitat for Humanity International with its
MicroBuild Fund.
$1,25/day
Ghana is 52,52% urban
INTERNATIONAL POVERTY LINE
51,8%
live on less than
$60/month
$2/day
$4/day
Source: compiled using data from GSS (2008 and 2014)
16
Quintile/
locality
Mean annual
household
expenditure
(GHS)
Mean annual
per-capita
expenditure
(GHS)
Percentage
shares
Percentage
of expen-
diture on
housing (%)
Mean annual
household
cash ex-
penditure
on housing,
water, electri-
city and gas
(GHS)
Mean annual
per-capita
cash expen-
diture on
housing,
water, elec-
tricity and
gas (GHS)
Total an-
nual cash
expenditure
on housing,
water, elec-
tricity and
gas (million
GHS)
Mean
household
size
Year
2008 2014 2008 2014 2008 2014 2008 2014 2008 2014 2008 2014 2008 2014 2008 2014
Lowest
821 3,924 132 664 7.1 5.6 3.4 10.9 12 — — 57 — — 6.4 6.1
Second
1,242 5,833 247 1,194 10.8 10.0 2.6 10.9 23 — — 106 — — 5.1 5.0
Third
1,500 7,444 367 1,761 14.7 14.6 2.5 11.5 36 — — 178 — — 4.4 4.4
Fourth
1,942 9,238 548 2,656 21.0 21.9 2.5 12.0 60 — — 276 — — 3.7 3.6
Highest
2,864 14,665 1,261 6,337 46.3 47.9 2.2 13.3 136 — — 709 — — 2.5 2.6
Accra
3,009 13,677 — 5,039 — 25.8 4.5 16.7 — — — — — — 3.3 3.4
Other
urban
2,170 9,841 — 3,407 — 39.9 2.2 12.6 — — — — — — 3.6 3.7
Urban
2,449 11,061 — 3,926 — 65.8 3.2 14.2 325 1,288 115 463 575 4,638 3.5 3.6
Rural
1,514 7,152 — 2,112 — 34.2 1.5 9.0 128 589 38 184 239 1,359 4.4 4.5
Ghana
1,918 9,317 644 3,117 100.0 100.0 — 12.4 212 1,015 71 354 814 5,997 4.0 4.0
Table 10 • HOUSING EXPENDITURE BY QUINTILE GROUP AND TYPE OF LOCALITY
Source: compiled using data from GSS (2008 and 2014)
17
Quintile Average annual
household income
(GHS)
Average annual
household
expenditure on
rent (GHS)
Average an-
nual per-capi-
ta expenditure
on rent (GHS)
Total annual
cash expen-
diture on rent
(million GHS)
Average
annual house-
hold expen-
diture on
maintenance
(GHS)
Average annual
per-capita
expenditure on
maintenance
(GHS)
Total annual cash
expenditure on
maintenance
(million GHS)
Year
2008 2014 2008 2014 2008 2014 2008 2014 2008 2014 2008 2014 2008 2014
Lowest
728 6,571.8 — — — — — — — — — — — —
Second
1,020 10,698.0 — — — — — — — — — — — —
Third
1,098 14,823.5 — — — — — — — — — — — —
Fourth
1,263 16,909.7 — — — — — — — — — — — —
Highest
1,544 25,200.9 — — — — — — — — — — — —
Accra
— 17,023.7 — — — — — — — — — — — —
Other
Urban
— 22,726.8 — — — — — — — — — — — —
Urban
— 20,930.1 — — — — — — — — — — — —
Rural
— 11,408.0 — — — — — — — — — — — —
Ghana
— 16,644.6 18 423.94 8 192.26 90 749.21 86 568.18 25 178.99 151 1,054.77
Table 11 • ANNUAL INCOME AND EXPENDITURE ON RENT

2524
The next tier of cities that could benefit from af-
fordable housing initiatives comprises Kumasi and
Sekondi-Takoradi. Kumasi, the capital of Ashanti
Region, is a very strong commercial centre in the
West African sub-region and is also a renowned
cultural centre. As such, it has a large population
(2.1 million in 2010), making it the second largest
city in the country. About 4% of households in
Ashanti Region live in houses unfit for human hab-
itation (GSS 2013). The region contains 16.9% of the
country’s housing stock but has the second highest
number of households per house (GSS 2013). De-
mand for housing in Kumasi is second only to that
of Accra. The coastal city of Sekondi-Takoradi has,
since the local discovery of oil in 2007, also been
growing increasingly rapidly, as substantial num-
bers of newcomers including lower-income house-
holds, move into the city region.
The third geographical area of interest is the Sa-
vannah Accelerated Development Authority (SADA)
region, which comprises the Upper West, Upper
East and Northern regions and northern portions
of the Brong-Ahafo and Volta regions. The SADA
region consists of small towns and cities including,
among others, Tamale (the largest), Wa, Bolgatan-
ga and Kintampo. The region is inhabited by more
than 4.4 million people with large household sizes
and the lowest level of expenditure on housing.
The Northern Region, for example, has consistently
recorded the highest household membership in
each censual year, with 7.7 members per household
recorded in the 2010 census. In the last four censu-
ses conducted in Ghana, average urban house-
holds' sizes in the Brong-Ahafo, Upper West and
Upper East regions were shown to be higher than
the national average (GSS 2014). Meanwhile, 1.2
households occupy one dwelling in the Northern
Region while over 35% of households in the three
northern most regions have one or two sleeping
rooms. In terms of housing quality, over 30% of the
housing stock of the three northern regions is built
with mud/earth. This area has the highest pro-
portion of such housing nationally, which means
that the quality of housing in these regions, often
regarded as the poorest in the country, needs to
be improved. Households in the rural savannah,
for example, have Ghana’s lowest mean annual
income at GHS 10,094.73 (GSS 2014).
What the above tells us is that Ghana’s affordable
housing market requires tailor-made and carefully
designed interventions that target specific market
segments. The market exhibits mixed characteri-
stics that appeal to all income groups, especially
households in the low-income category. The avai-
lability of local building materials, land and labour
could be explored further to support customised
solutions that are low cost.
D
ue to market inelasticity, emerging an-
ecdotal evidence suggests that the formal
housing supply targeted at the high-income
bracket is practically at saturation point in Accra.
Indeed, it is not uncommon for luxury apartments
to remain vacant for up to two years in the ca-
pital. Furthermore, the rents for such properties
appear to be falling from the peak levels recorded
in 2007–2009. The case has never been clearer or
more urgent for the market to refocus, moving
away from current practices that price out middle-
and low-income earners and towards delivering
housing that meets the needs of lower-income
customers.
There are several ways to identify which elements
of affordable housing offer the most exciting pro-
spects for those interested in affordable housing
initiatives – be they opportunities for improving
quality, tenure, occupancy or location. As discus-
sed previously with regard to Table 4, it is not
possible to determine housing quality merely by
considering the materials used to build it. The
actual condition of the part of the building being
surveyed (e.g. external walling) must also be consi-
dered. For instance, the 2000 and 2010 PHC surveys
do not indicate the condition of the sandcrete wal-
ling, which makes it difficult to determine the scale
of the business opportunity for those interested in
providing home improvement services. The obvious
exception to this is, of course, housing built using
materials that are patently of insufficient quali-
ty, such as tents and improvised homes (kiosks,
containers, etc.). What is required, then, are further
studies to determine the condition of the materials
used for the elements of housing in question.
A substantial proportion of households living in
rent-free situations as well as those perching or
squatting are likely to reside in relatively poor con-
ditions. In GAMA 23% of the metropolitan region’s
housing stock is occupied in these ways, in other
cities and towns this figure rises to 29%, and in
rural areas it is 27% (GSS 2014). De-crowding the
smaller dwellings, particularly the one-room and
two-room types, by adding another room would,
for the most part, substantially reduce the level of
crowding occurring within them. As these types of
accommodation are often associated with low-in-
come households and are typically found in com-
pound housing, a building extension programme
for small dwellings would have a significant impact
on affordable housing stock.
Housing demand and ability to pay differs from
one city region to the next. Of the several geogra-
phical areas identified as key locations for initi-
ating the proposed affordable housing business
models, GAMA is the most important. Here, resi-
dents have the highest per-capita income and they
spend proportionately higher amounts on housing
(16.7%). The metro region’s socio-economic, admi-
nistrative and political character acts as a magnet,
drawing large numbers of migrants into the city re-
gion each year. These migrants, who come seeking
better livelihoods, have diverse economic profiles
and come from within and outside of Ghana. The
Greater Accra Metropolitan Area (GAMA) is current-
ly home to 16% of Ghana’s population, making the
scale of the market for affordable housing in Accra
vastly bigger than in other locations. As the GAMA
has a varied population, its housing need has both
quality and quantity dimensions.
INTERESTING AREAS FOR AFFORDABLE HOUSING
2726
commercial parking space
playground
S
everal governments, especially from the im-
mediate post-independence era, recognised
housing as both a basic right and a catalyst
for sustained economic development. Over time
different governments have adopted slightly diffe-
rent approaches to housing, depending on the le-
vel of priority attached to it and on the macro-eco-
nomic conditions of the period. As such, the sector
has witnessed interventions ranging from policy
and direct financing, to housing provision and
home improvement schemes, among others. A
significant proportion of these interventions were
concentrated on Ghana’s major cities. The 1986
National Shelter Strategy sought to refocus policy
towards minimal state intervention in the housing
market and on creating an enabling environment
(Bank of Ghana 2007). Since then, state interven-
tions have been diverse, covering areas including
research on and the promotion of local building
material use, land reform and the establishment of
land banks (either directly or through quasi-state
organisations).
STATE AND QUASI-STATE INTERVENTIONS
Over the years, a number of property market actors – be they state, quasi-
state, private sector, NGO, housing cooperative, and credit union – have designed
and implemented programmes aimed at delivering affordable housing. In many
instances, the cost of the end-product differs substantially from the anticipated
end-price. This section attempts to catalogue major housing interventions
in Ghana from the post-independence era to date as well as ‘successful’
interventions from non-state actors.
Affordable housing
interventions in Ghana
5
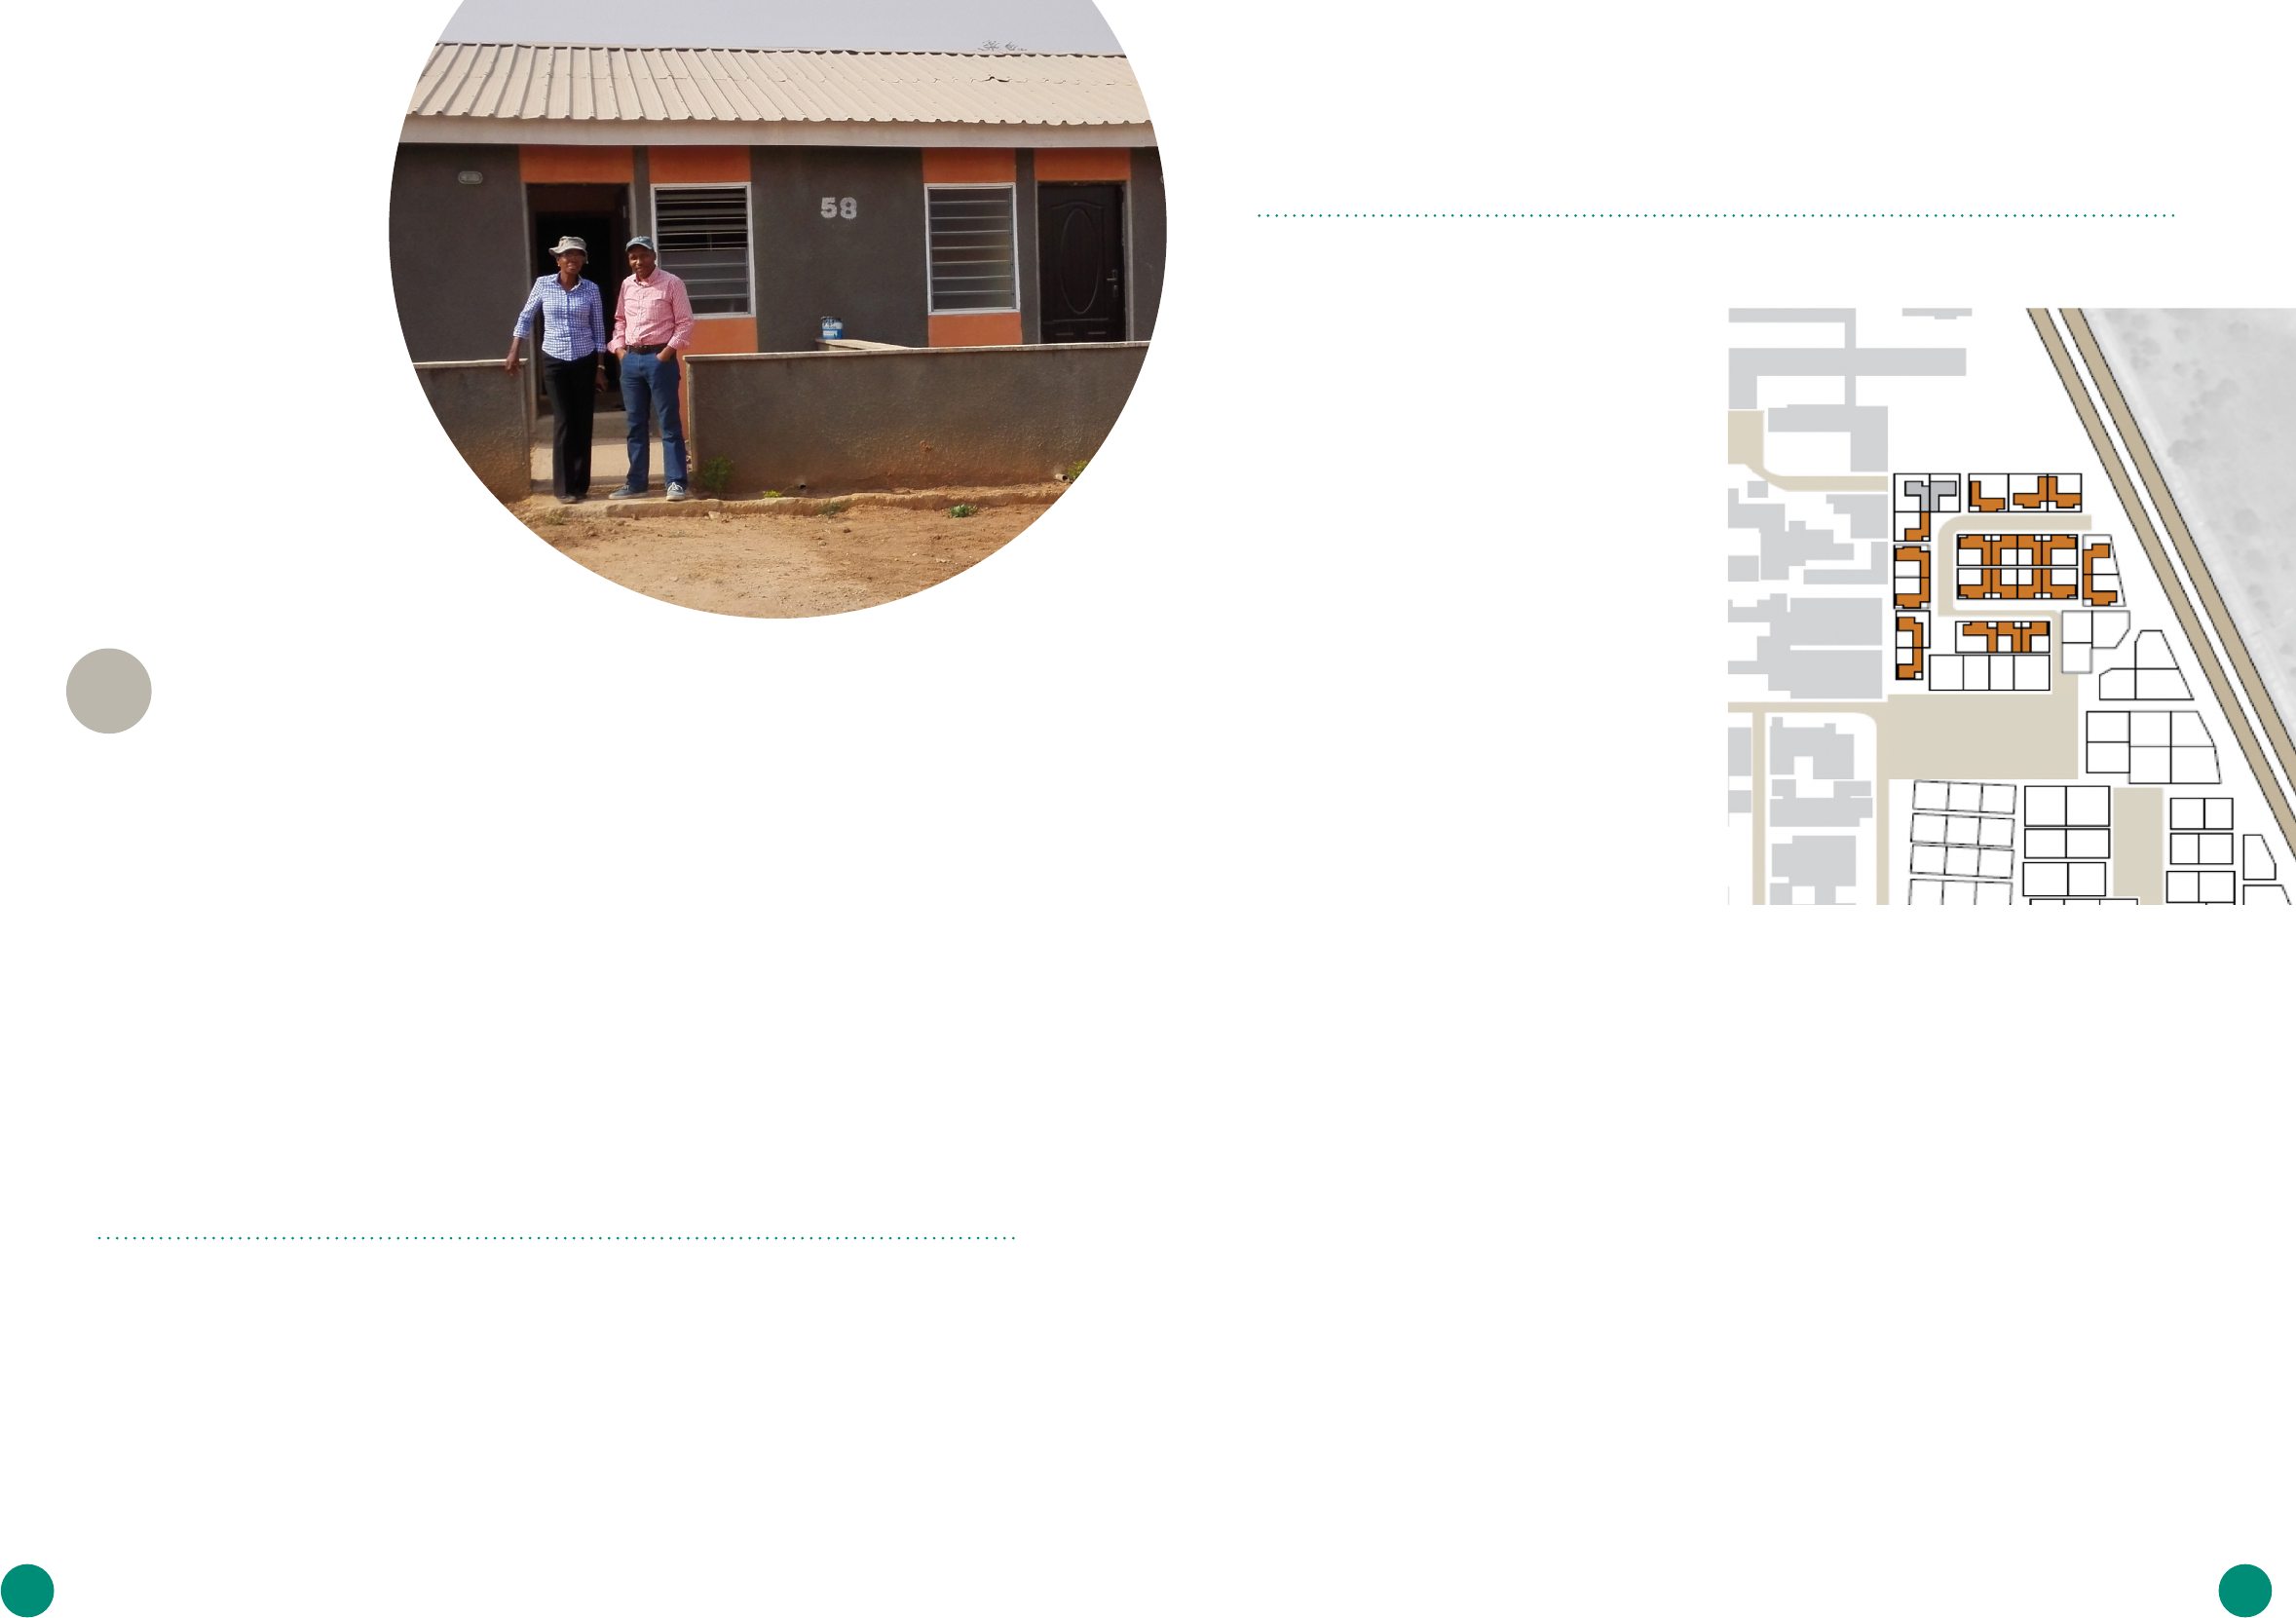
Photos: RegencyFoundation, Turelinckx, Puyvelde and Vandenbempt (2011)
T
he 103 founding members of Tema Housing
Cooperative (THC) were low-income people
living in the Tema area, earning month-
ly incomes of around USD 50–80. Established
in 1972, the THC’s central aim was to provide its
members with affordable housing (that could be
subsequently extended). The Tema Development
Cooperation (TDC) granted the THC land sufficient
to build 105 housing units. In its first phase the
THC housing units each cost GHS 2,812 (equal to
approximately USD 2,400) and comprised a single
bedroom, a lounge, kitchen, washing and toilet
facilities plus extra foundations installed for the
optional addition of up to three bedrooms at a
later date. The project was carried out in three
phases, with phases one and two supported with
a total of GHS 168,000 in loans from the govern-
ment’s Low-Cost Housing Scheme. By 1987 a total
of 52 units, comprising a mixture of one- and
two-bedroom houses, had been completed, all of
which offered varying options for extension. At this
time, members were also in the process of building
another 48 units.
By the end of phase two, the THC had repaid
the government loan and its associated interest
charges, and had trained a number of its mem-
bers to carry out the planning and design of phase
three, which was subsequently approved by the
TDC. However, inflationary pressure in this period
devalued the THC’s savings, which prevented the
Cooperative from moving forward with the next
phase of housing. It did, however, lay the founda-
tions for the remaining 53 units and the owners
used private means to complete them. Infrastruc-
ture including road surfacing (unsealed), drains,
water and electricity connections (both off- and
on-site) and the central sewer were progressively
and wholly financed by THC members.
Owners of all the houses built in phases one and
two have since expanded their homes, adding
further rooms either for residential or commercial
purposes. This can be seen as a mark of the mo-
del’s success. Although the THC still exists and plans
to develop another phase, there is no space for any
further developments at its current site. In addition,
members also decreased their contributions to the
Cooperative once their houses were complete.
NON-STATE HOUSING INTERVENTIONS – HOUSING COOPERATIVES
Tema Housing Cooperative
2928
B
lue Rose Ltd was originally founded in 1987
as a floristry business but, in 2005, the
company decided to venture into property
development. It has since built over 900 housing
units consisting of two-bedroom terrace houses,
two- and three-bedroom semi-detached houses,
two- and three-bedroom detached houses, and
two-bedroom terraced houses, usually set within
gated communities. The housing provided targets
different segments of the market – from the working
middle classes to the top end of the upper classes.
The residents of Blue Rose estates are employed
across a wide spectrum of occupations including
teaching, nursing, law, the civil service, etc.
The cheapest unit, a one-bedroom expandable
unit, costs GHS 80,000. The most expensive unit, a
four-bedroom detached house, costs GHS 292,000
or its equivalent in another currency.
The finance to build the housing comes from com-
mercial loans from lenders including the HFC Bank.
Prospective buyers are required to make a 100%
cash payment or take on a mortgage with a com-
pulsory 20% down-payment. Mortgages are usually
arranged with the HFC Bank or Ghana Home Loans.
Additionally, a charge of GHS 3,000 is paid to cover
the documentation and utilities.
Another 1,000 two- to four-bedroom homes are
planned to be built at Kasoa near Budumburam
in 2016. In 2014, at the BID International Quality
Summit in New York, Blue Rose was awarded the ti-
tle of the ‘Most affordable real estate developer in
Africa committed to building houses to the highest
quality standards’.
I
n 2013 the Affordable Housing Project in Tama-
le, with funding from REAL UK (a peer-to-peer
lending platform for small and medium-sized
property developers), began developing a total of
200 two-bedroom detached houses at two loca-
tions within the Tamale Metropolitan Area.
One site belongs to the Tamale Cooperative Credit
Union (TCCU), which undertook to develop the pro-
perties for its members, while the other was made
available by the Tamale Metropolitan Assembly in
order to provide housing for interested staff wor-
king in its decentralised departments. The Assem-
bly is also installing the required infrastructure at
both sites. Potential buyers were required to pay
20% of the unit cost
21
upfront, with the remainder
to be paid over five years at an interest rate of
18% per annum. In 2015 the project stalled due
to funding issues and the irregular reporting of
progress on project implementation. This has since
been resolved and, at the time of writing, work was
scheduled to resume in June 2016. By the end of
April 2016, 100 units were about 65% complete at
the TCCU site, a total of 23 units were fully comple-
te at both sites, and the remaining properties were
at various stages of completion.
PRIVATE SECTOR INTERVENTIONS
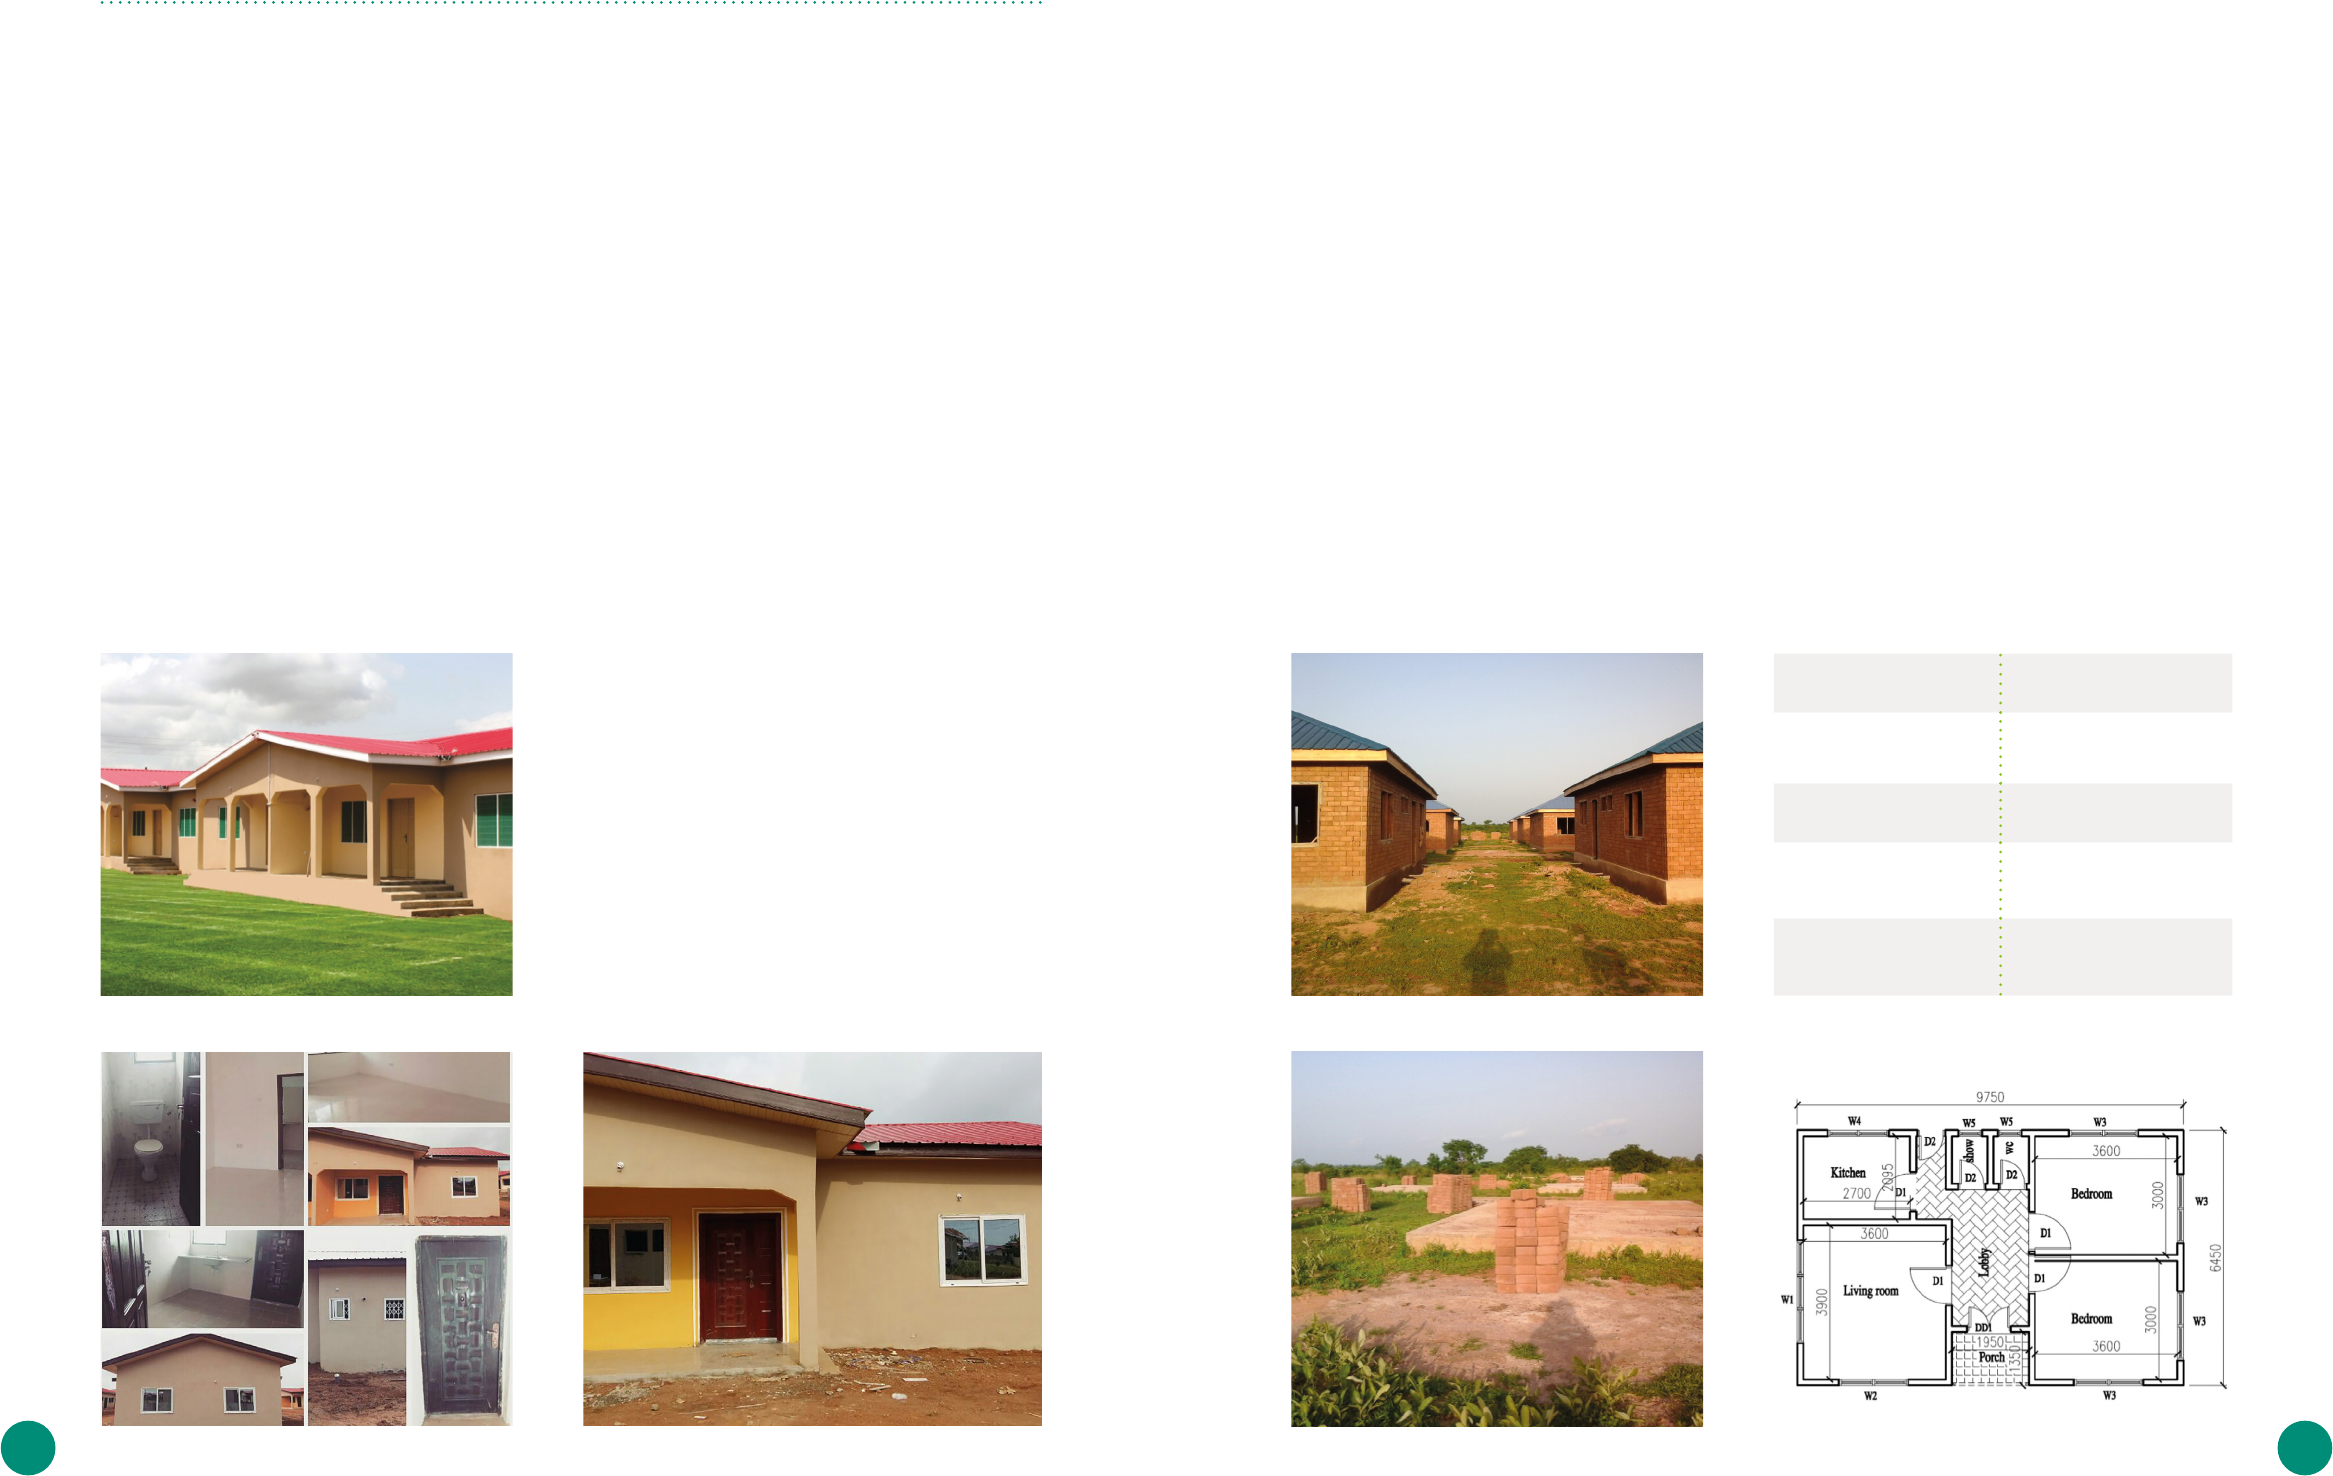
Blue Rose Ltd Tamale Affordable Housing Project
PROJECT DATA
LOCATION
Lahagu
TARGET GROUP
Active poor
TOTAL NUMBER OF
UNITS
200 units (100 at each site)
SPECIAL FEATURE
Focus on homeownership
support services
Figure 5 • A TWOBEDROOM TERRACE HOUSE
Photos: Blue Rose 2016, Water and Sanitation for Africa (2016)
3130 31
T
he TAMSUF project, implemented with sup-
port from the UN-HABITAT Slum Upgrading
Facility (SUF), promoted the development
of affordable housing units for the Amui Djor slum
community. The primary objective was to develop,
test and apply new and innovative means for
financing pro-poor urban development projects,
with an emphasis on domestic capital mobilisati-
on. UN-Habitat support involved the provision of
grants including an initial USD 400,000 for capital
enhancement and another USD 100,000 for admi-
nistration and development (Tweneboa 2011). The
project also benefited from a total of GHS 79,714 in
subsidies accruing from government’s contribution
(37%), contributions received from Peoples Dialo-
gue Ghana (43%), and the value of the land (20%).
The project built a total of 31 apartments compri-
sing a mixture of single-room self-contained and
two-bedroom apartments. The project determined
the costing for building a single-room apartment
to total GHS 6,500 but, upon completion of the
units, this cost had almost doubled (UN-HABITAT,
2011).
To make the units affordable, they were cross-sub-
sidised through the installation of 15 shop units
as well as public toilets and bathing facilities to
be rented as business ventures. This reduced the
cost of a single self-contained room and two-be-
droom apartment to GHS 6,576.68 and GHS 13,157.36
respectively (Tweneboa 2011). Beneficiary house-
holds, made an upfront payment of GHS 1,000. To
enable them receive loans, they formed a coopera-
tive group and then received loans guaranteed by
UN-HABITAT of GHS 1,500 from People’s Dialogue
22
and approximately GHS 4,000 from AmalBank, each
to be repaid within 10 years. Beneficiaries pay a
total of GHS 75 a month to service their loans.
Project managers acknowledge key challenges
including; access to the land, ability of beneficia-
ries to service loans, securing credit arrangements
for beneficiaries and some members withdrawi-
ng membership from the cooperative (Tweneboa
2011). Presently, members of the cooperative are
meeting their repayment obligations. Also, import-
antly, the cooperative has entered into negotia-
tions to purchase land adjoining its current site for
the next phase of its housing development.
PROJECT DATA
LOCATION
Amui Djor
TARGET GROUP
Slum dwellers
TOTAL NUMBER OF
UNITS
31 apartments
SPECIAL FEATURE
GHS 79,714 in subsidies
COST
Monthly rent of GHS 75 for a
one-bedroom unit and GHS
140 for a two-bedroom unit
MAIN CHALLENGE
Tenure security
Addressing the
challenges of
affordable housing
6
A
pproximately 85% of households (Figure
3) can afford housing but are currently not
considered by formal property developers.
The size of the market for affordable housing and
the dearth of affordable housing solutions on the
market presents a wide range of opportunities –
e.g. in financing, direct provision, maintenance and
servicing, etc. To benefit from these opportunities,
different schemes can be modelled to target spe-
cific pro-poor objectives and financing schemes.
Market dynamics coupled with population growth
and urbanisation provide a significant basis for
affordable housing provision in the country in the
medium to long term.
When it comes to investing in real estate, the sup-
ply gap is now in affordable housing. The density
of market demand is, however, unevenly distribu-
ted across the country. The major cities present a
cross-section of all affordable housing needs and
have the highest demand for affordable housing.
Similarly, a significant proportion of the estima-
ted GHS 1.2 billion affordable housing market is
based in urban areas; in rural areas, the need
for affordable housing is more tied to improving
housing quality. Affordable housing solutions must
therefore be designed to target the specific needs
of households in all these different contexts.
T
hose providing affordable housing need to
consider the whole value chain of housing
provision, which involves four main stages
(Figure 6). The first stage involves land acquisition,
planning, design and the acquisition of permits for
the proposed housing. The cost of land, administ-
rative processes to acquire titles and permits, and
on-site infrastructure constitute the first hurdles to
delivering affordable housing. For instance, it takes
around three months to secure the land titles for a
plot of land rented under customary tenure, which
is not only slow, but also incurs high transaction
costs. Cutting the bureaucracy and transaction
costs involved would help to accelerate the pace of
housing delivery.
The second stage, production and construction,
involves three main overarching approaches: home
extensions, maintenance and retrofitting, and new
home construction.
SIZE OF THE AFFORDABLE HOUSING MARKET
THE HOUSING VALUE CHAIN
TAMSUF Affordable Housing Project in Ashaiman Municipality
Sourcing
& design
Production &
construction
Sales &
marketing
Maintenance,
deconstruction
& recycling
23
Photos: RegencyFoundation, Tweneboa (2011)
Figure 6 • THE HOUSING VALUE CHAIN

3332
H
ouseholds currently living in units abo-
ve the two-persons-per-room threshold
laid down in the new planning and zoning
standards are considered to be in need of additi-
onal and affordable housing. The understanding
underpinning this determinant is that households
living as such would rent the additional rooms re-
quired to ensure the comfort of household mem-
bers if they could afford to do so. In urban areas,
in particular, a common practice is for relatives to
put up with family members until the latter are in
a position to rent their own apartments (see Tables
5 and 6). In such cases, it is often children who are
most affected by the resulting overcrowding, as it
is they who usually have to share their rooms with
the new occupants. In worse cases, even the pa-
rents also end up having to share their rooms with
extended family members. The provision of addi-
tional rooms for such households would therefore
radically ease congestion.
Overcrowding appears to be more of an urban pro-
blem, with the largest proportion of overcrowded
dwellings occurring in the country’s major cities of
Accra, Kumasi and Secondi-Takoradi. Since these
cities are hotspots for commercial, administrative
and social capital, they attract different kinds of
migrants. Those who cannot afford decent housing
end up in slums and/or crowded housing condi-
tions. Disposable incomes are, however, higher in
urban areas, with more people in a better position
on the affordability scale.
As table 15 shows, financing schemes for home
improvements and/or extension are an essential
component in the suite of solutions that are par-
ticularly targeted at low- to middle-income earn-
ers. The uptake of the HFC Boafo and Sinapi Aba
Trust home financing schemes demonstrates that
landlords are willing to take on loans for home
improvements and that renters are willing to pay a
little more for additional or improved housing fa-
cilities. However, the interest rates on these loans
limit their accessibility and make the loans more
difficult to repay.
O
ver 100,000 new dwelling units are re-
quired annually to house the additional
households in Ghana, and a total of 5.7
million additional rooms are needed by 2020.
Property investors may wish to build dwelling units
themselves or instead, finance the building or
purchase of properties.
The new housing could be greenfield develop-
ments and come in the form of incremental
housing, expandable housing, non-expandab-
le units or complete units. Delivery options for
expandable housing units could include wet core
areas or shell and core structures. Based on the
housing needs assessment, investors may choose
to engage in the provision of expandable housing
units, particularly for people in slum areas and
for single households who may require additional
space. Horizontal incremental housing does, howe-
ver, conflict with Ghana’s spatial vision of densified
cities and the associated preference for vertical
home construction.
A
fourth business model involves the standar-
disation of construction processes and skills
and the development of alternative building
materials. The use of locally available building
materials, including pozzolana, bamboo, laterite,
timber and clay, among others, has the potential to
drive down housebuilding costs (Figure 7). Materi-
als and labour constitute over 70% of the cost of
housebuilding (UN-HABITAT 2011). The tendency in
Ghana is to use sandcrete blocks and cement; a
conventional technology that is not only expensi-
ve, but also requires longer building construction
durations especially for on-site developments. If
Ghana is to build the affordable housing it needs,
it must therefore find alternative materials and
seek ways to reduce built delivery times and la-
bour costs.
The Kumasi-based Buildings and Roads Research
Institute has carried out several studies on the use
of local building materials. Although several alter-
natives have been identified and developed, their
deployment has yet to be to scaled up. And thus,
at present, 90% of the building materials used in
Ghana are imported (UN-HABITAT, 2011).
The mass utilisation of local building materials
could also engender new employment opportuni-
ties along the housing value chain (with the caveat
that the standardisation of these materials needs
to incorporate sustainability principles). The use
of certain locally manufactured building materials
such as hydrofoam involves simple step-by-step
processes that could easily be assimilated and
used by local artisans, unskilled builders and even
prospective homeowners themselves. Indeed, cer-
tain materials are so easy to use that it would be
possible for households to build their own homes.
Transferring the knowledge and skills associated
with these techniques generates opportunities
for micro-entrepreneurship. Skills training pro-
grammes would also ensure that the quality and
standards required for large construction projects
can readily be sourced locally.
A
second line of intervention involves sche-
mes that help households to repair their
respective homes and improve the quality
of services available to the home. A significant
proportion of homes are in an extremely poor
condition, requiring major improvement and
maintenance works. Such improvements could also
include de-crowding measures to ensure that pro-
perties meet the two-persons-per-room standard,
especially in the country’s northern regions and its
slum areas.
24
Clearly, this approach represents a
huge opportunity for the market, with microfinance
organisations particularly well placed to promote
their lending options for home upgrading.
25
The TAMSUF project’s experience described above
suggests that providing rooms in storeyed buil-
dings instead of in separate units is viable and is
an affordable option for poor households. Ho-
wever, the success of such projects is contingent
on huge subsidies and/or cross-subsidies. The
SUF’s Kojokrom Market project in Sekondi-Takoradi
potentially offers a more sustainable approach
to delivering affordable housing for low-income
households. The project involved the constructi-
on and sale of market stalls to 60 women market
vendors and is expected to at least double the
incomes of these beneficiaries. As a result, it is
not unlikely that these women will now consider
upgrading their homes with their extra earnings.
This assumption reflects the approach taken by
most Ghanaians who tend to access loans for pro-
fit-making ventures and then use the returns on
these ventures to build or improve their homes.
Home extension, improvement and completion schemes
Maintenance and Retrofitting
Construction of new units
Standardisation of Labour and Local Building Materials
Material and labour
71%
Financing
15%
Land 9%
Infrastructure 5%
Figure 7 • COST COMPONENTS OF A TYPICAL
HOUSE BUILT BY FORMAL PRIVATE SECTOR
Source: UN-Habitat (2011)
3534
F
igure 7 on the cost of housing suggests alter-
native yet complementary ways of dealing with
housing affordability. At first glance, labour
and materials together constitute the largest cost.
However, a significant proportion (90%) of the buil-
ding materials used in Ghana are imported and are
thus affected by the weakening currency and infla-
tionary pressures, which substantially increase the
costs of housebuilding. For housing to be affordable
to prospective low-income households, import sub-
stitution – where imported building materials are
substituted with locally available and/or produced
ones – is essential. In the absence of an explicit
policy imperative, a public discussion is needed on
building materials, the results of which can be used
to guide policy directions, including fiscal measures
to direct and stimulate import substitution.
Similar to building materials and labour, construc-
tion methods also have a role to play in reducing
build costs. In Ghana, building technologies have
remained practically unchanged for several deca-
des now and this stasis is preventing the house-
building sector from profiting from economies of
scale. By standardising their construction methods
and design elements, such as heights and fixtu-
res, housebuilders could minimise costs and also
increase productivity as workers gain experience
from repeating work processes. Further savings are
possible through the mass production of building
components off-site (pre-fabrication). Today’s frag-
mented building materials supply chain also needs
to be made more efficient so it can complement
improvements in materials.
STRATEGIES FOR AFFORDABLE HOUSING DELIVERY
INTERNATIONAL FIRMS
LOCAL MICRO, SMALL
AND MEDIUM-SIZED
COMPANIES
PUBLIC INSTITUTIONS
FINANCIAL INSTITUTIONS
(BANKS, MFIS, ETC.)
Leading bids for new housing
development projects (e.g.
workforce accommodation
schemes for security services)
Providing local building mate-
rial inputs
Promoting land banks and
mixed building schemes for
both low-income and luxury
apartments that allow for
cross-subsidy
Providing financing schemes
and mortgages for housing
construction
Providing advanced techni-
cal know-how, machinery or
building materials to local
partners
Sub-contracting works or
building-related services out
from larger firms
Setting up joint ventures
with international and local
companies to build low- and
middle-income housing de-
velopments
Offering MFIs schemes for
home maintenance, upgra-
ding and extension, and the
purchase of home accessories
including renewable energy
technologies
Transferring successful bu-
siness models for low- and
middle-income housing to the
local market
Participating in building
maintenance
Research and training pro-
grammes on the use of local
building materials and tech-
nologies
—
Building large-scale mar-
ket-specific affordable
housing developments
Providing insights on local
market conditions to interna-
tional firms
— —
Working with building material
wholesalers to market inno-
vative construction materials
and inputs
Directly supplying building
material inputs, photovoltaics,
etc. to households via local
distribution agents
— —
—
Providing building materials
and services to local develo-
pers
— —
—
Working with building material
wholesalers to market inno-
vative construction materials
and inputs
— —
—
Providing retrofitting services
for existing buildings
— —
Table 13 • MATRIX OF BUSINESS OPPORTUNITIES
Labour and materials
A
ccess to land in good locations is essential
for reducing the cost of housing. Since it is
usually the largest single item of real-esta-
te expenditure, the cost of securing serviced land
will directly affect the cost of the housing built on
it. Land values in the major cities are extremely
high, driving all new housing developments to
these cities’ peripheries where land is relatively
cheaper. Yet, within the cities a number of suitable
sites are presently underutilised or in some cases
vacant. Underutilised and vacant lands belonging
to the state could be leased to private develo-
pers with contractual conditions that require a
percentage of the development to be given over to
affordable housing.
Land administration and registration often involves
long and difficult bureaucratic processes and often
results in high transaction costs. Consequently,
most houses are constructed without building per-
mits or on lands without titles. This, in turn, limits
the ability of those owning homes on such sites to
access the housing finance that would normally be
available to them.
T
he average interest on mortgages available
to prospective homeowners ranges from
30% to 42% per annum. This is unaffordable
for the majority of the population and especially
for low-income households. This situation is not
exclusive to the housing sector per se, but reflects
the general cost of borrowing in Ghana. Efforts to
tackle this issue therefore largely involve public
policy. Improvements in underwriting would help
banks to safely make more housing loans available
to lower-income borrowers. Additionally, the state
could help to minimise developers’ financing costs
by making affordable housing projects less risky
– e.g. by guaranteeing a certain percentage of the
housing cost to protect developers against losses
incurred by buyers or tenants defaulting on their
payments for finished units.
I
n Ghana, a critical question for developers
is exactly who will bear the cost of both on
and off-site infrastructure (i.e. roads, waste
management, water and electricity). The current
ambiguity to this regard compels private develo-
pers to pay the installation costs and then pass
them on to homebuyers. As such, the prices of
properties developed by the formal private sector
in areas with no existing trunk infrastructure are
pushed even higher. A cost sharing and/or cost re-
covery arrangement between the public sector and
private developers would incentivise private sector
participation to install these kinds of facilities.
Senegal has rolled out a number of initiatives
to make housing affordable as part of its One
Family, One Roof programme. These involve
providing potential homebuilders with incen-
tives – namely, free land and tax holidays for
imported construction equipment – as well as
a 3.3% subsidy for target homebuyers purcha-
sing the properties. However, to enjoy these
benefits, individual units must not cost more
than USD 15,500 (CAHF 2012).
MAKING HOUSING AFFORDABLE
Box 4 • MAKING HOUSING AFFORDABLE
Land supply and location
Financing
Urban infrastructure and municipal services
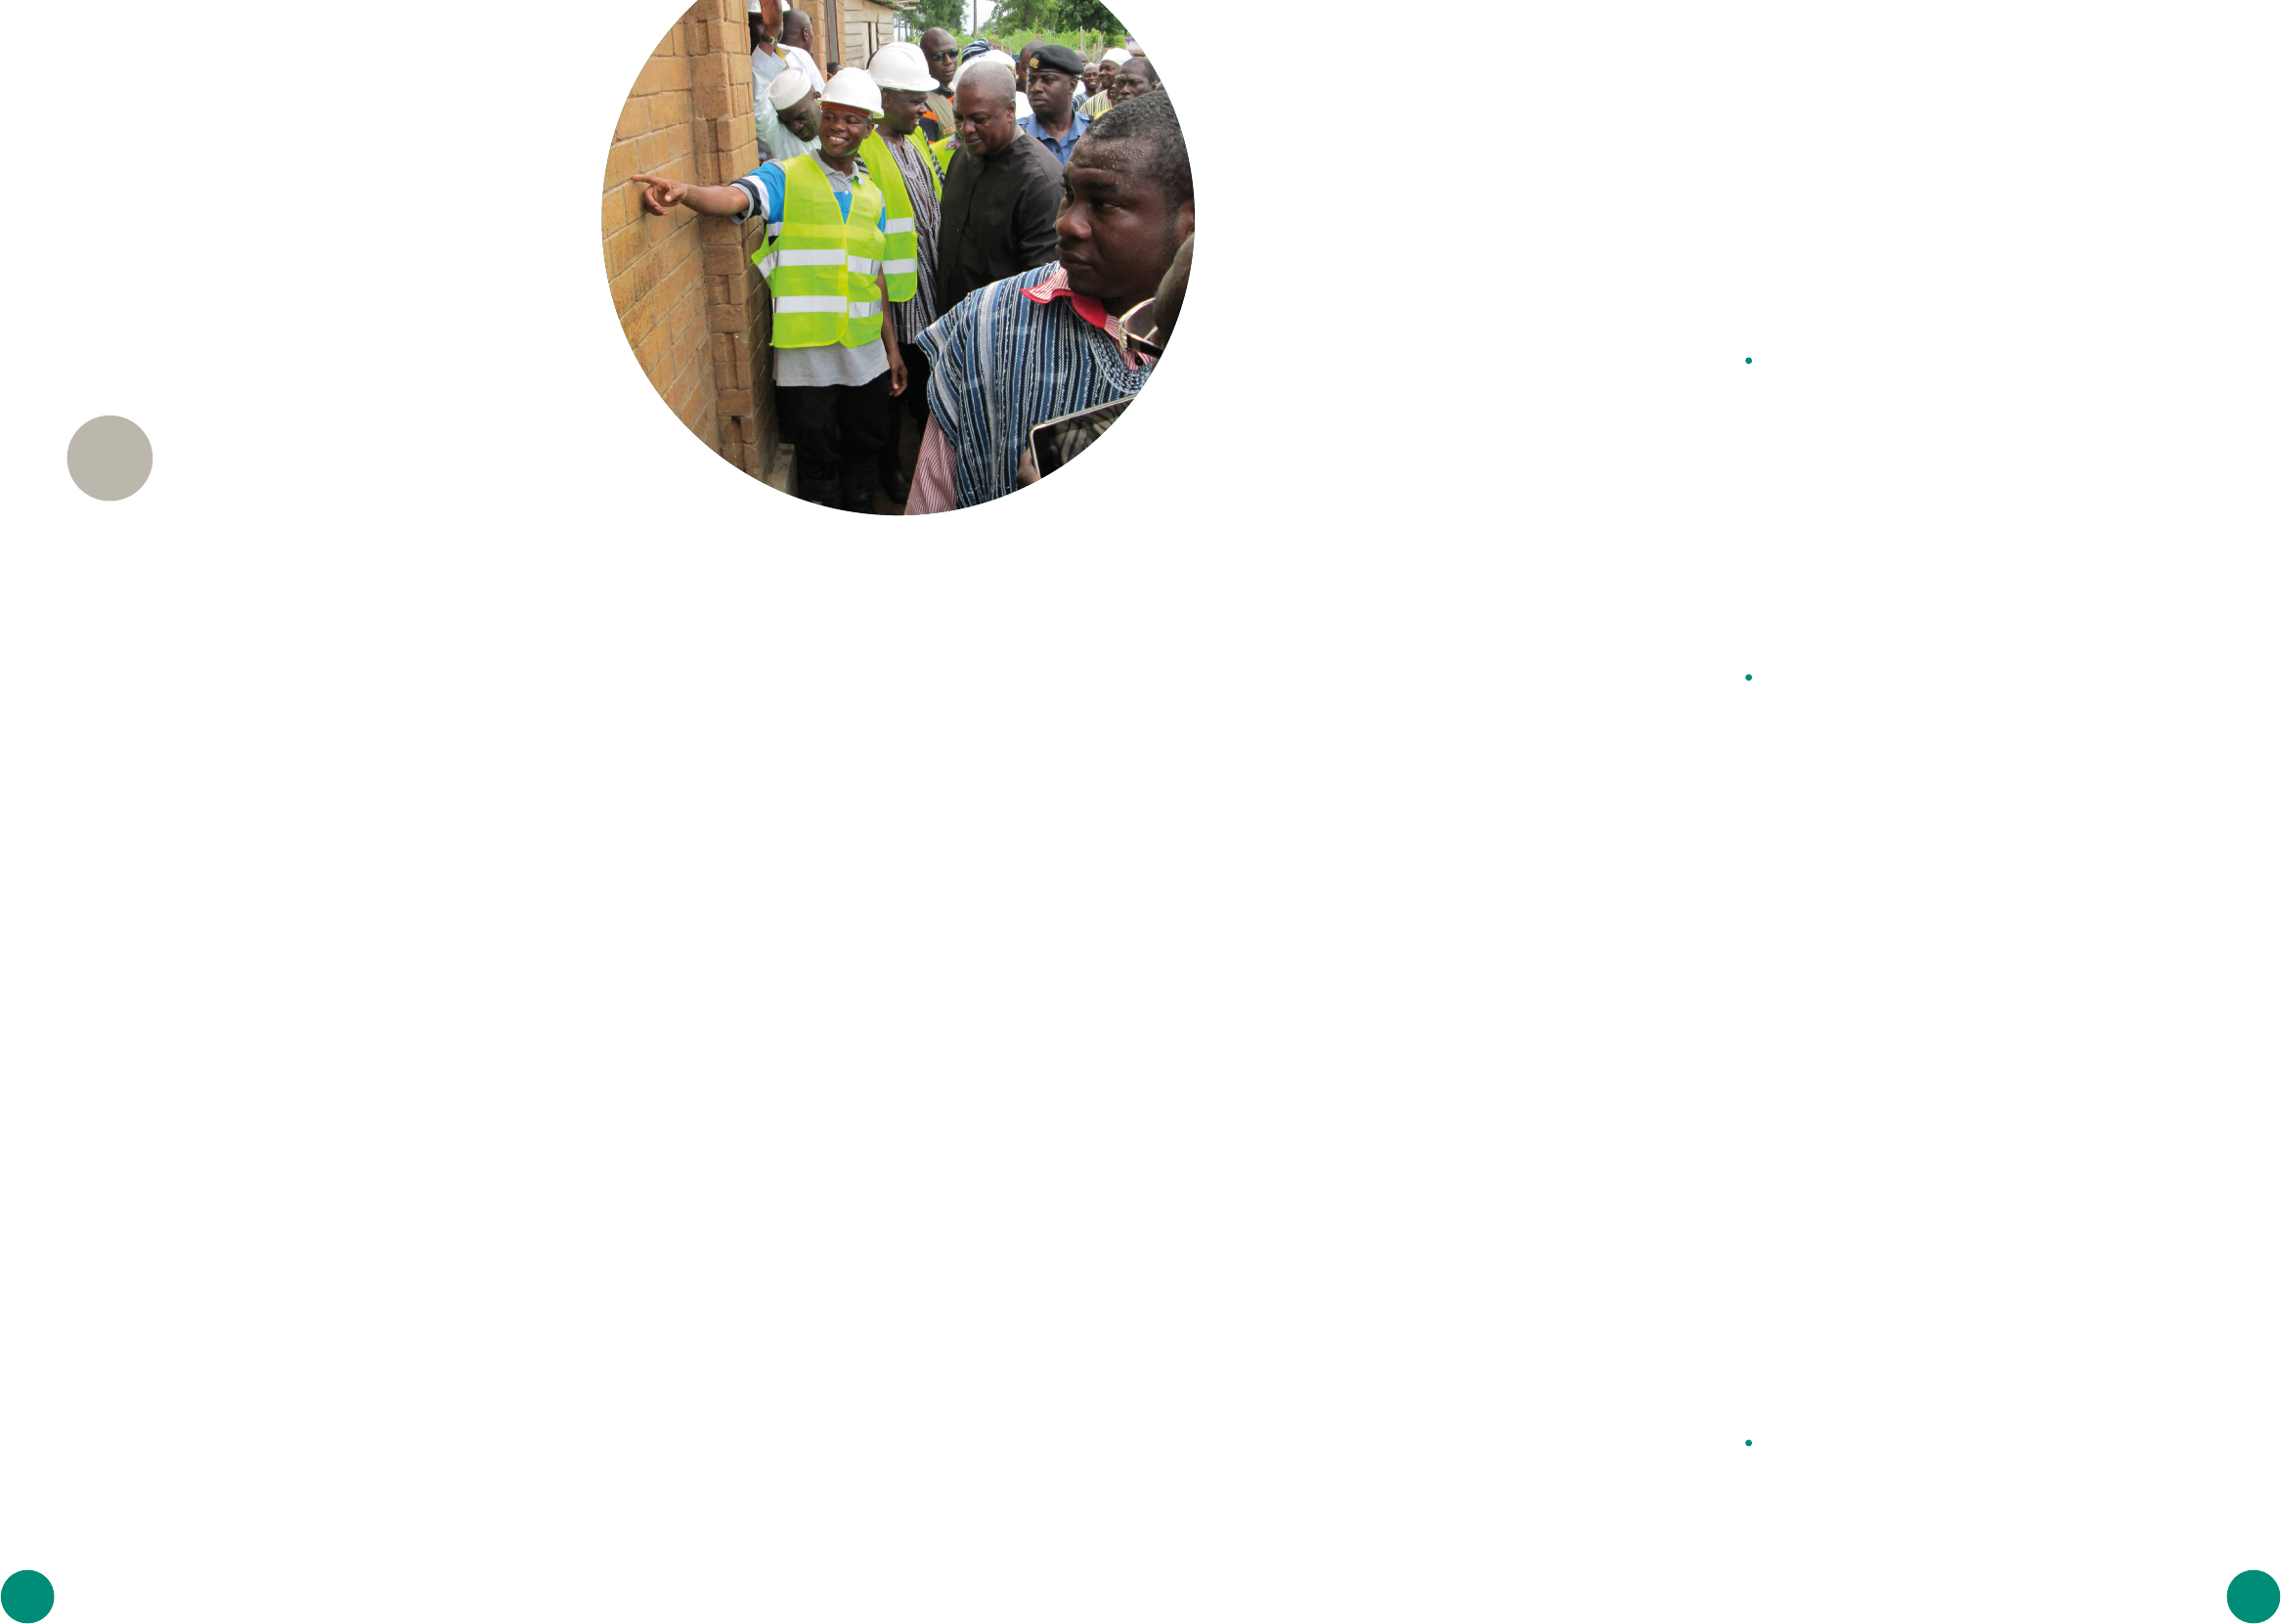
3736
This section of the report presents sampled views of experts and slum dwellers
on affordable housing.
Customer and
value proposition
7
Views on affordable housing: Ellen Oteng Nsiah,
Executive Director, Housing the Masses
In my view, the term affordable housing in Ghana
has been misused. Housing affordability is com-
monly measured as housing costs that equate to
up to 30% of one’s income. However, what may be
affordable for a middle-income earner, may not
be for a low-income earner. It is therefore prefer-
able to use the term low-income housing, in order
to specifically describe the target group under
discussion. As such, the term affordable housing
should be used for general purposes to describe
decent and adequate housing that consumes one
third or less of your income, no matter what inco-
me group you fall in. The term should not, however,
be used to describe the housing of a particular
socio-economic group: affordable housing does
not equate to low-income housing.
Affordable housing solutions
With the active support and participation of gover-
nment, relevant stakeholders must make a cons-
cious effort to initiate, coordinate and collaborate
on both the demand and supply sides of housing
provision, especially that for low-income groups.
Secondly, comprehensive and diverse solutions
need to be developed, including incremental provi-
sions, that are tailored to the housing needs of the
various income and socio-cultural groups. Sustain-
able financing must also be put in place for both
the demand and supply sides of housing.
To enable sustainable housing provision for all
income groups, but particularly for low-income
groups, the country’s land regulators and authori-
ties need to develop a short, transparent, cheaper
and better-supervised land acquisition process.
Financing and subsidies should be made availab-
le to both the demand and supply sides, and the
capacities of stakeholders need to be developed in
a sustainable way that, enables those in the formal
and informal sectors to work together effectively.
Sector professionals also need to be made aware
of how to make housebuilding profitable, which
will encourage them to build more.
Where necessary, this would involve training and
informing stakeholders on how to deliver and
acquire affordable housing and especially low-in-
come housing. The government should also take a
lead role in promoting stakeholder collaboration
and instilling the confidence required to make
housing truly affordable to all and especially to
people on low-incomes.
Challenges to private sector provision of affordable
housing
One of the several factors that have made the
private sector reluctant to invest in affordable
housing is the lack of adequate financing for af-
fordable housing, especially low-income housing,
on both the demand and supply sides. Another is
that not all stakeholders are prepared to work in
the low-income housing sector, as they consider
the low-income market, rooted generally in the
informal economy, to be a high-risk area. There is
also a lack of adequate experience among formal
and professional actors in Ghana’s wider housing
sector of working effectively, sustainably and
successfully with low-income earners. Low-income
earners and informal sector workers also often
have no experience of formal sector business
transactions and processes, which can deter them
from engaging with the formal housing sector for
their housing needs, even when they have the
resources to do so. As a result, the market remains
too small to attract the attention of private sector
investors.
Key barriers to affordable housing projects
Key barriers include cumbersome land acquisi-
tion processes that make land and thus housing
more expensive, insufficient financing for both the
demand and supply sides of housing that is also
difficult to access, and the inappropriate options,
designs and materials offered for low-income
housing.
Views on affordable housing: Tony Asare, Principal
Architect at Tekton Consult
Asare asserts that the definition of affordable
housing is not static and should be better descri-
bed as low-income housing rather than affordable
housing. The inference is that it is easier to de-
termine what constitutes low income and thus a
low-income household, and hence to target inter-
ventions at this market segment. When it comes to
the concept of affordability, he states that what is
affordable to him will not be affordable to many
other people. Asare explains that he has designed
buildings worth USD 1.6 million for clients who
view them as affordable. Meanwhile, less expensive
schemes costing in the region of USD 100,000 are
deemed unaffordable by other clients.
Asare believes that we are behaving like ostriches.
When one considers the current daily minimum
wage in Ghana and compares that against the cost
of housing, it means some people will never be able
to afford their own housing in their life time. Gover-
nment must therefore step in to build homes for
low-income people, especially those in urban areas.
Challenges to affordable housing and alternative
propositions
Land:
Without considerable financial enginee-
ring, the cost of urban land in Ghana will
prohibit the construction of affordable housing,
and securing vacant plots in the cities is also
difficult. Furthermore, obtaining the appropri-
ate land titles and documentation can also be
a challenge. As Asare states ‘every poor man
wants to build a mansion so they build little by
little’. To do this, they build far away from the
city where infrastructure is lacking but land is
cheap.
Building materials:
A key concern regarding the
use of improved local building materials is their
acceptability to potential homebuyers. The type
and use of alternative materials is influenced by
people’s preferences, culture and perceptions
of quality. For instance, in urban areas people
generally prefer sandcrete blocks. Glass has
also become a mark of modernity in the cities.
If alternative building materials are to be taken
up on a large scale, public acceptability issu-
es – a key constraint on the scaling up of local
building material deployment – must be com-
prehensively managed.
There are other factors that limit the use of
say compressed earth blocks. Given the lack
of open land in the cities, there are questions
about where the earth will be extracted from.
If it is brought in from rural areas, the cost of
transporting raw materials may outweigh the
cost savings normally achieved by the techno-
logy.
Another way of reducing the cost of building
materials is through targeted fiscal policy mea-
sures that would cut taxes on materials being
imported specifically to build cheap affordable
housing.
Design:
The way housing is designed can make it
affordable. Building layouts and configurations,
and designing and arranging regular geometric
and functional spaces all contribute to making
housing affordable. A building’s economics
must therefore be factored into its design.
Photo: Prime-Stat SVC Ltd.

3938
Infrastructure:
Many sites and newly emerging
settlements lack infrastructure and municipal
services. When a settlement lacks adequate
infrastructure, it easily becomes depressed. In
settlements or estates built by the private sector,
the cost of providing the required infrastructure,
including roads and electricity, is transferred to
the end-customer, which drastically increases
house prices and rents. Further discussion is
therefore required on who should pay to install
infrastructure in unserved and underserved
areas. Under the current system, any privately
purchased electricity poles and wiring that are
installed to connect a house or settlement to the
main electrical supply, automatically revert to
public ownership within 24 hours of installation.
Any national discussion to this regard should
focus on expanding access to public infrastruc-
ture and on how this will be financed. A policy
change that requires government to provide
on-site infrastructure will mean that housing
developments can be built on serviced plots. An
arrangement for pre-financing public infrastruc-
ture installation costs might also be put in place
to stimulate private sector interest in providing
serviced plots for sale.
Financing:
Interest rates on mortgages are very
high, commonly ranging from 32% to 45% per
annum. By contrast, in Senegal, where the infla-
tion rate stands at less than 7%, average mort-
gage interest rates vary from 8% to 12% per an-
num. The macro-economic climate means that
investors can invest in housing with relatively
more certainty. Asare states, for example, that
he has had clients seeking to buy properties
in Ghana but, when it comes to taking out the
required mortgage, they decided not to proceed
due to the exorbitant cost of borrowing.
Reluctance of the private sector to provide
affordable housing?
The primary motivation for private sector actors to
invest in housing is to make a profit. They there-
fore naturally seek to invest in the high end of the
market where there is less risk and higher returns
on investment. The private for profit actor will not
sell a house with a market value of USD 100,000
for USD 60,000 just because of a desire to make it
affordable. One way to encourage affordable de-
velopment is to build planning conditions and ob-
ligations into contractual agreements that require
developers to develop a specified proportion of the
proposed overall scheme as affordable housing.
Background
Haruna is 35 years old and lives in Old Fadama,
one of the major slum settlements in the Greater
Accra Metropolitan Region. He is the head of his
household, comprising seven people, and owns the
four-bedroom house in which they currently reside.
Before moving to Old Fadama, Haruna lived at Lung-
bunga in the Tolon District of the Northern Region
with his grandfather, parents and siblings – a house-
hold comprising 20 people.
Physical infrastructure
At his current residence, Haruna has easy access to
water, electricity and sanitation services including a
private household toilet facility and bathroom.
Income and expenditure
Haruna is employed as an administrator in the informal
sector. With a monthly household income of GHS 1,000,
his monthly household expenditure averages 40% (GHS
400), which is spent on, among others things; food,
water, electricity, transport and health care.
Housing and land
Haruna owns his four-bedroom house, which
comprises two structures: one built with sandcre-
te and the other with wood. However, the land on
which these structures are built belongs to the Accra
Metropolitan Assembly, which means that his house
in Old Fadama is in effect a temporary structure.
The main factors that influenced the location of this
house were its proximity to Haruna’s workplace, how
protected the area is from flooding and, above all,
the low cost of the housing unit.
Perceptions of affordable housing
Haruna pointed out that too many housing schemes
have been built for the formal and higher-earning
income groups and that informal and lower-income
earning groups have been neglected. He empha-
sised that, although several affordable housing
interventions are ongoing in Ghana, the costs and
administrative/legal issues involved make it impos-
sible for informal sector practitioners like himself to
participate. For Haruna, affordable housing should
have basic finishing and a moderate price that
is affordable for the poor in society and that can
feasibly be paid off within five years. He added that,
over the years, government has developed a number
of affordable housing schemes but, by the time they
are completed, the cost of their housing units is no
longer affordable, especially to the lower-income
group to which he belongs. His opinion is that, unless
mechanisms are put in place to enable the poor to
overcome the cost and administrative/legal hurdles
to accessing affordable housing units, the poor will
continue to be marginalised in this area. ‘The gover-
nment pretends to be providing affordable housing
units; we will also pretend to be receiving them while
we sleep on the streets’, he concluded.
NO NAME AGE OCCUPATION
MONTHLY
INCOME (GHS)
1
Majeed Yakubu 36 Computer engineer 500
2
Sulemana William 45 Unemployed —
3
Abigail Frimpong 23 Student —
4
Zakaria Adam 20 Student —
5
Sadeek Yakubu 15 Student —
6
Alhassan Abukari 12 Unemployed —
7
Haruna Abu
(head of household)
35 Administrator 1000
Household members
HARUNA ABU
39
Photo: Prime-Stat SVC Ltd.
4140
Background
Marvin is 24 years old, lives in Kokomlemle, around
the Kwame Nkrumah Circle, and works for a security
firm as a daytime security guard. He lives indepen-
dently in a single room. Prior to moving to Accra,
Marvin lived at Breman in Ashanti Region where he
lived with his family in a household of six people.
Physical infrastructure
At his current residence, Marvin has easy access to
water, electricity and sanitation services such as a
toilet facility and a bathroom, all contained within his
house’s compound.
Income and expenditure
Marvin is employed by a formal sector private securi-
ty company as a daytime security guard and earns an
average monthly income of GHS 150. He spends on
average GHS 120 per month on food, clothing, water
and transportation.
Housing and land
Marvin lives in a one-bedroom apartment built of
sandcrete that is owned by his employer. There are
six other rooms, one of which is occupied by another
tenant and the rest unoccupied. His accommodation,
which is provided by his employer, is included as part
of his employment contract, so he does not pay rent.
A block of offices belonging to his employer is loca-
ted on the same site as his dwelling. Key factors that
influenced his choice of accommodation were the
cost of the housing unit, its proximity to his place of
work and the easy access it affords to basic facilities
and services such as electricity, water and sanitation
services.
Perceptions of affordable housing
Marvin indicated that housing in Ghana is very
expensive and tailor-made for the higher-income
group. He added that government interventions to
address the great disparity in access have, so far, not
delivered the desired results and that, ‘All the so-cal-
led affordable houses are not in any case affordable’.
He expressed the need for government to build mass
housing schemes that offer units to low-income
groups at a cost they can afford. In conclusion, he
indicated that ‘while the cost of housing in Ghana
keeps rising, the government will never manage to
get everybody off the streets’.
Background
Rashida is 34 years old and was born and still resides
in Ashaiman, a well-known shanty town in Ghana
made up of lower-income households. She belongs
to a male-headed household comprising 10 people
who live together in a wooden structure owned by
her father.
Physical infrastructure
Rashida’s home is supplied with electricity, which
costs her household GHS 40 per month. The main
source of water for Rashida’s household is a commu-
nity pipe where one bucket of water costs GHS 0.50.
On average, her household spends GHS 90 a month
on water, which they use for bathing, cooking and
washing. Rashida’s home has a bathroom but no toilet
facility. Her household therefore uses a public facility
that is distant from the house and costs GHS 0.50 per
visit. On average, her household spends about GHS
150 on accessing the toilet facility monthly.
Income and expenditure
The average monthly income for Rashida’s house-
hold is GHS 2,800. On average, GHS 900 of this is
spent each month on food, clothing, water, transport,
and in accessing sanitation services.
Housing and land
Rashida’s dwelling has five rooms and the land it sits
on belongs to the Tema Traditional Council. As such,
she considers her dwelling to be a temporary struc-
ture and fears that her household could be evicted at
any time by the Council. The key factors influencing
her choice of a housing unit are, most importantly,
how much it costs and then how close it is to her
place of work, how well protected it is from flooding,
and how easy it is to access basic facilities such as
electricity, water and sanitation.
Perceptions of affordable housing
Rashida indicated that housing in Ghana is not easily
accessible and, even when it is, it is very expensive.
She added that affordable housing in Ghana is not
‘affordable’ for poor and low-income earners. She
expressed the need for government to subsidise up
to 20% of the cost of housing units and to provide
occupants with a rent-to-own financing model that
enables them to pay for their affordable housing
units. In conclusion, she indicated that, when the
term ‘affordable’ is applied to housing, the poor
should be able to afford it. The system should be so
inclusive that even a sachet water seller would be
able secure a place to live and pay for over time.
NO NAME AGE OCCUPATION
MONTHLY
INCOME (GHS)
1
Mohammed Mahamud (head of household) 71 Trader 1,000.00
2
Rukayatu Mahamud 55 Trader 200.00
3
Ibrahim Mahamud 38 Carpenter 500.00
4
Yussif Mahamud 36 Port assistant 300.00
5
Rashida Mahamud 34 Seamstress 500.00
6
Fatau Mahamud 27 Student (tertiary) -
7
Selasi Mahamud 23 Office assistant 300.00
8
Ayuba Mahamud 20 Unemployed -
9
Barikisu Mahamud 19 Student (Senior High School) -
10
Fauzan Mahamud 13 Student (Junior High School) -
Household members
MARVIN SALIFU RASHIDA MAHAMUD
4140
Photos: Prime-Stat SVC Ltd.
4342
There is a two-way relationship between the structure of the housing market and
land administration on the one hand and the financing mechanisms available to
developers and prospective homeowners on the other. A well-structured land and
housing market enables the provision of formal financing mechanisms for housing;
but when the market functions poorly, informal mechanisms prevail. Sources of
funding in the Ghanaian property sector and particularly in the informal sector are
derived largely from personal savings and income. Formal financing schemes largely
price out low-income earners.
A
large proportion of housing in Ghana is sup-
plied informally by households for themsel-
ves and their families, for extended family
members and also for rent. In rural areas 62.1% of
households own their places of abode, compared
with 32.8% in urban Ghana (GSS 2014), with dwel-
lings construction largely financed using personal
savings (UN-HABITAT, 2011). About a third of house-
holds have savings accounts or contribute to a
savings scheme, with 46.4% of urban households
compared to 21.5% of rural households operating a
savings account. PricewaterhouseCoopers (Gha-
na) Ltd. reported that, in 2011, 80% of Ghanaians
were non-banked, which underlines the challenge
housing finance agencies face in rolling out finan-
cing programmes in the country.
Given the national average household income of
GHS 16,644.60 per annum (GSS 2014), households
need to save consistently for quite a number
of years to be in the position to build their own
housing, meaning people do not become ho-
meowners until well into their middle age. In 1993,
UN-HABITAT (2011) identified the mean age group
for becoming a homeowner in Accra, Kumasi and
Berekum to be the 45- to 49-year-olds group.
Incremental housing is a piecemeal building
approach, which makes it possible for low-income
earners to build their homes either horizontally or
vertically one stage at a time. To understand the
timescales involved, a civil servant on an average
wage who adopts this approach will usually have
fully completed their building towards the end of
his or her career.
SELF-FINANCING
Financing mechanisms
available for affordable housing
8
I
n general, few Ghanaians take out loans for
housing and in rural households in particular
uptake is markedly low (Table 15). Instead peop-
le prefer to engage in business, either as a start-
up or by expanding/improving existing activities.
Proceeds from these ventures are then invested
in housing development. Arguably, improving the
quality of one’s housing does not provide direct
short-term returns on investment, whereas in-
vesting loans in commercial activities certainly
does offer opportunities for a quick return on
investment as well as a steady stream of inco-
me. Informal sector workers therefore seek loans
for business rather than for housing (Shumann
and Miamidian 2009). For slum dwellers, there is
less motivation to carry out home improvements
because of the insecurity of their tenure.
LOANS FROM INFORMAL BORROWING, NON-FINANCIAL
INSTITUTIONS AND BANKS
2008 2014
SOURCE PERCENTAGE SOURCE PERCENTAGE
Relative/friend/neighbour 53.35 Relative/friend/neighbour 22.0
Trader 15.3 Savings and loans scheme 19.6
State bank 8.3 Private bank 18.6
Private bank 6.45 Public bank 12.2
Cooperative 4 Susu scheme 7.9
Source: compiled using data from the GLSS 5 and GLSS 6 reports.
Table 14 • TOP FIVE SOURCES OF HOUSEHOLD LOANS IN 2008 AND 2014
2008 2014
GAMA ALL URBAN ALL RURAL GAMA ALL URBAN ALL RURAL
LAND
26
— — — 26.3 81.9 18.1
AGRICULTURAL
INPUTS
1.2 2.5 12.3 0 19.3 80.7
BUSINESS
35.7 35.1 27.1 9.2 62.0 38.0
HOUSING
10.8 17.7 3.9 7.7 72.6 27.4
EDUCATION
AND TRAINING
16.7 13.5 6.5 6.3 51.8 48.2
VEHICULAR
1.9 1.5 0.8 24.3 64.5 35.5
Source: GSS (2008 and 2014).
Table 15 • PURPOSES FOR WHICH LOANS WERE TAKEN OUT
4544
As Table 14 shows, micro-loans provided by non-
bank financial institutions (NBFIs) are an essential
component of the loan mix reported in 2014. The
efforts of such institutions (namely credit unions
and savings and loan companies) to establish
financing portfolios are usually targeted at low-in-
come households. Loan products usually support
land purchase or home completion, improvements
or extension. HFC Boafo Susu Savings, an infor-
mal-sector-focused subsidiary of HFC Bank, was
established expressly in order to provide housing
loans to informal workers. It is currently attemp-
ting to diversify its loan portfolio by extending its
services to landlords, increasing its marketing tar-
geted at informal urban dwellers and widening its
geographical area of operations (UN-HABITAT 2011).
In a similar vein, Sinapi Aba Savings and Loans Ltd
received USD 1 million of USAID funding, disbursed
via Opportunity International USA, as part of the
Agency’s 2010 housing microfinance pilot initia-
tive involving Sinapi Aba and International Land
Systems. Under the two-year scheme, Sinapi Aba
provided housing microloans while International
Land Systems provided site plans to beneficiaries
in the Ashanti and Brong-Ahafo regions. Following
the success of the pilot, Sinapi Aba has sought
alternative sources of funding to continue the
programme.
In 2012 a second initiative got underway aimed at
promoting the growth of housing microfinance and
incremental housebuilding. Funded by MasterCard
and Habitat for Humanity International Ghana,
this USD 2.2 million five-year pilot project enga-
ged three microfinance companies – Sinapi Aba
Savings and Loans Ltd, uniCredit Ghana Ltd and
Opportunity International Savings and Loans Ltd
– in providing technical support for the develop-
ment of housing microloan products (CAFH 2015).
However, after the pilot project closed, only Sinapi
Aba Savings and Loans was able to sustain its ac-
tivities, with the other two MFIs withdrawing, citing
a lack of funds to progress the initiative. As such,
some 20,000 housing microloans for low-income
earners in mainly rural areas failed to be issued as
planned (CAHF, 2015).
Kumasi-based Global Access Savings and Loans
Ltd offers housing microfinance loans to low-in-
come earners in both urban and rural areas of
the Ashanti Region, while Opportunity Internatio-
nal Savings and Loans Ltd offers loans for home
improvement and incremental building. These two
institutions are among the top ten microfinance
institutions in the country.
Interest rates on housing loans in 2015 range from
36% to 42% per annum at HFC Boafo Susu Savings
and Loans, Global Access and Sinapi Aba, with loan
ceilings set at USD 26,155, USD 13,077 and USD 5,230
respectively (Bezant and Laufer, 2016).
Other NBFIs are doing things differently. Several
credit unions are venturing into housing financing,
providing loans to members for the acquisition of
land, which is usually located in peri-urban areas.
The credit unions adopting this approach are
mainly those operated by churches or professional
unions. Besides issuing loans for home completion
or improvement, loans may also be granted in the
form of land. For example, the University for De-
velopment Studies and Tamale Cooperative Credit
Union have acquired large tracts of land in Tama-
le, plots of which could be allocated directly to
members. However, at present, it is not possible to
determine the sum total of loans issued by credit
unions specifically for housing. However, the Ghana
Cooperative Credit Unions Association currently re-
ports a membership of over 429 registered unions.
O
f the 31 banks operating in Ghana, nine
have official status as providers of mortga-
ge facilities to customers – namely Access
Bank Ghana, Bank of Baroda, Ecobank Ghana, HFC
Bank Ghana, Fidelity Bank, CAL Bank, Stanbic Bank
Ghana, First National Bank Ghana and United
Bank for Africa Ghana. Each of these banks offers
products across four main categories. The most
popular product is the home purchase mortgage,
which is used for buying new houses and requires
the borrower to make a 20% down payment, with
the bank providing a loan to cover the remaining
80%. The repayment period is usually 20 years. The
next two products, home improvement and home
completion mortgages, have a shorter repayment
period of five years and are used to either renova-
te an existing property or complete a house under
construction. The fourth product, the home equity
mortgage, is, as the name suggests, used to release
equity locked up in a property.
HFC Bank, Ghana’s largest mortgage provider, has
always asserted that it provides housing finance
for workers. However, the cost of its mortgages
price out most of its intended customer base,
making their mortgages the reserve of ‘low-risk’
borrowers. As a result of this exclusion, mortgages
have become unpopular among homebuyers. The
total value of mortgages in the country as at 2010
averaged 0. 25% of GDP, whereas South Africa with
a more developed housing finance market stood at
22.5% of GDP in 2014 (CAHF 2015).
Ghana Home Loans (GHL), which is transitioning
from the non-banking sector to the banking sec-
tor,
28
is the leading residential mortgage lender,
with nearly half of the market share nationally.
In 2014 GHL granted loans worth a total of USD
91,080,000 to 1,526 customers. This increased to
USD 97,100,000 issued to a total of 1,651 beneficia-
ries in 2015 (GHL 2016, unpublished data).
29
Since
it began its operations, GHL has provided home
financing worth a total of USD 160,000,000. The
company provides additional packages to custo-
mers including 100% mortgages and land purchase
and homebuilding mortgages.
MORTGAGES FROM BANKS AND NON-BANK INSTITUTIONS
INSTITUTION GROSS LOAN PORTFOLIO (GHS)
SINAPI ABA SAVINGS AND LOANS LTD
57,838,603
ASA SAVINGS AND LOANS LTD
36,218,600
OPPORTUNITY INTERNATIONAL SAVINGS AND LOANS LTD
56,590,868
FIRST ALLIED SAVINGS AND LOANS LTD
27,673,205
Source: compiled from http://www.mftransparency.org/
Table 16 • LOAN PORTFOLIO OF THE TOP FOUR NBFIS IN 2013
NO BANK
ANNUAL INTEREST
RATE
1
Bank of Baroda 24.5-28.8%
2
CAL Bank 35.3%
3
EcoBank 19.0-29.3%
4
GN Bank
27
0%
5
HFC Bank 29.7 – 30.3%
6
Stanbic Bank 23.0-32.0%
7
Zenith Bank 29%
Source: Bank of Ghana 2016.
Table 18 • INTEREST ON MORTGAGES FROM
SELECTED BANKS SEPTEMBER, 2016
PORTFOLIO IN
USD MILLIONS
MARKET
SHARE (%)
GHANA HOME
LOANS
84 47
HFC BANK
47 27
FIDELITY BANK
24 14
CAL BANK
6 3
GHANA COM-
MERCIAL BANK
4 2
BARCLAYS BANK
12 7
TOTAL
177 100
Source: GHL 2013.
30
Table 17 • THE GHANAIAN MORTGAGE MARKET IN 2013
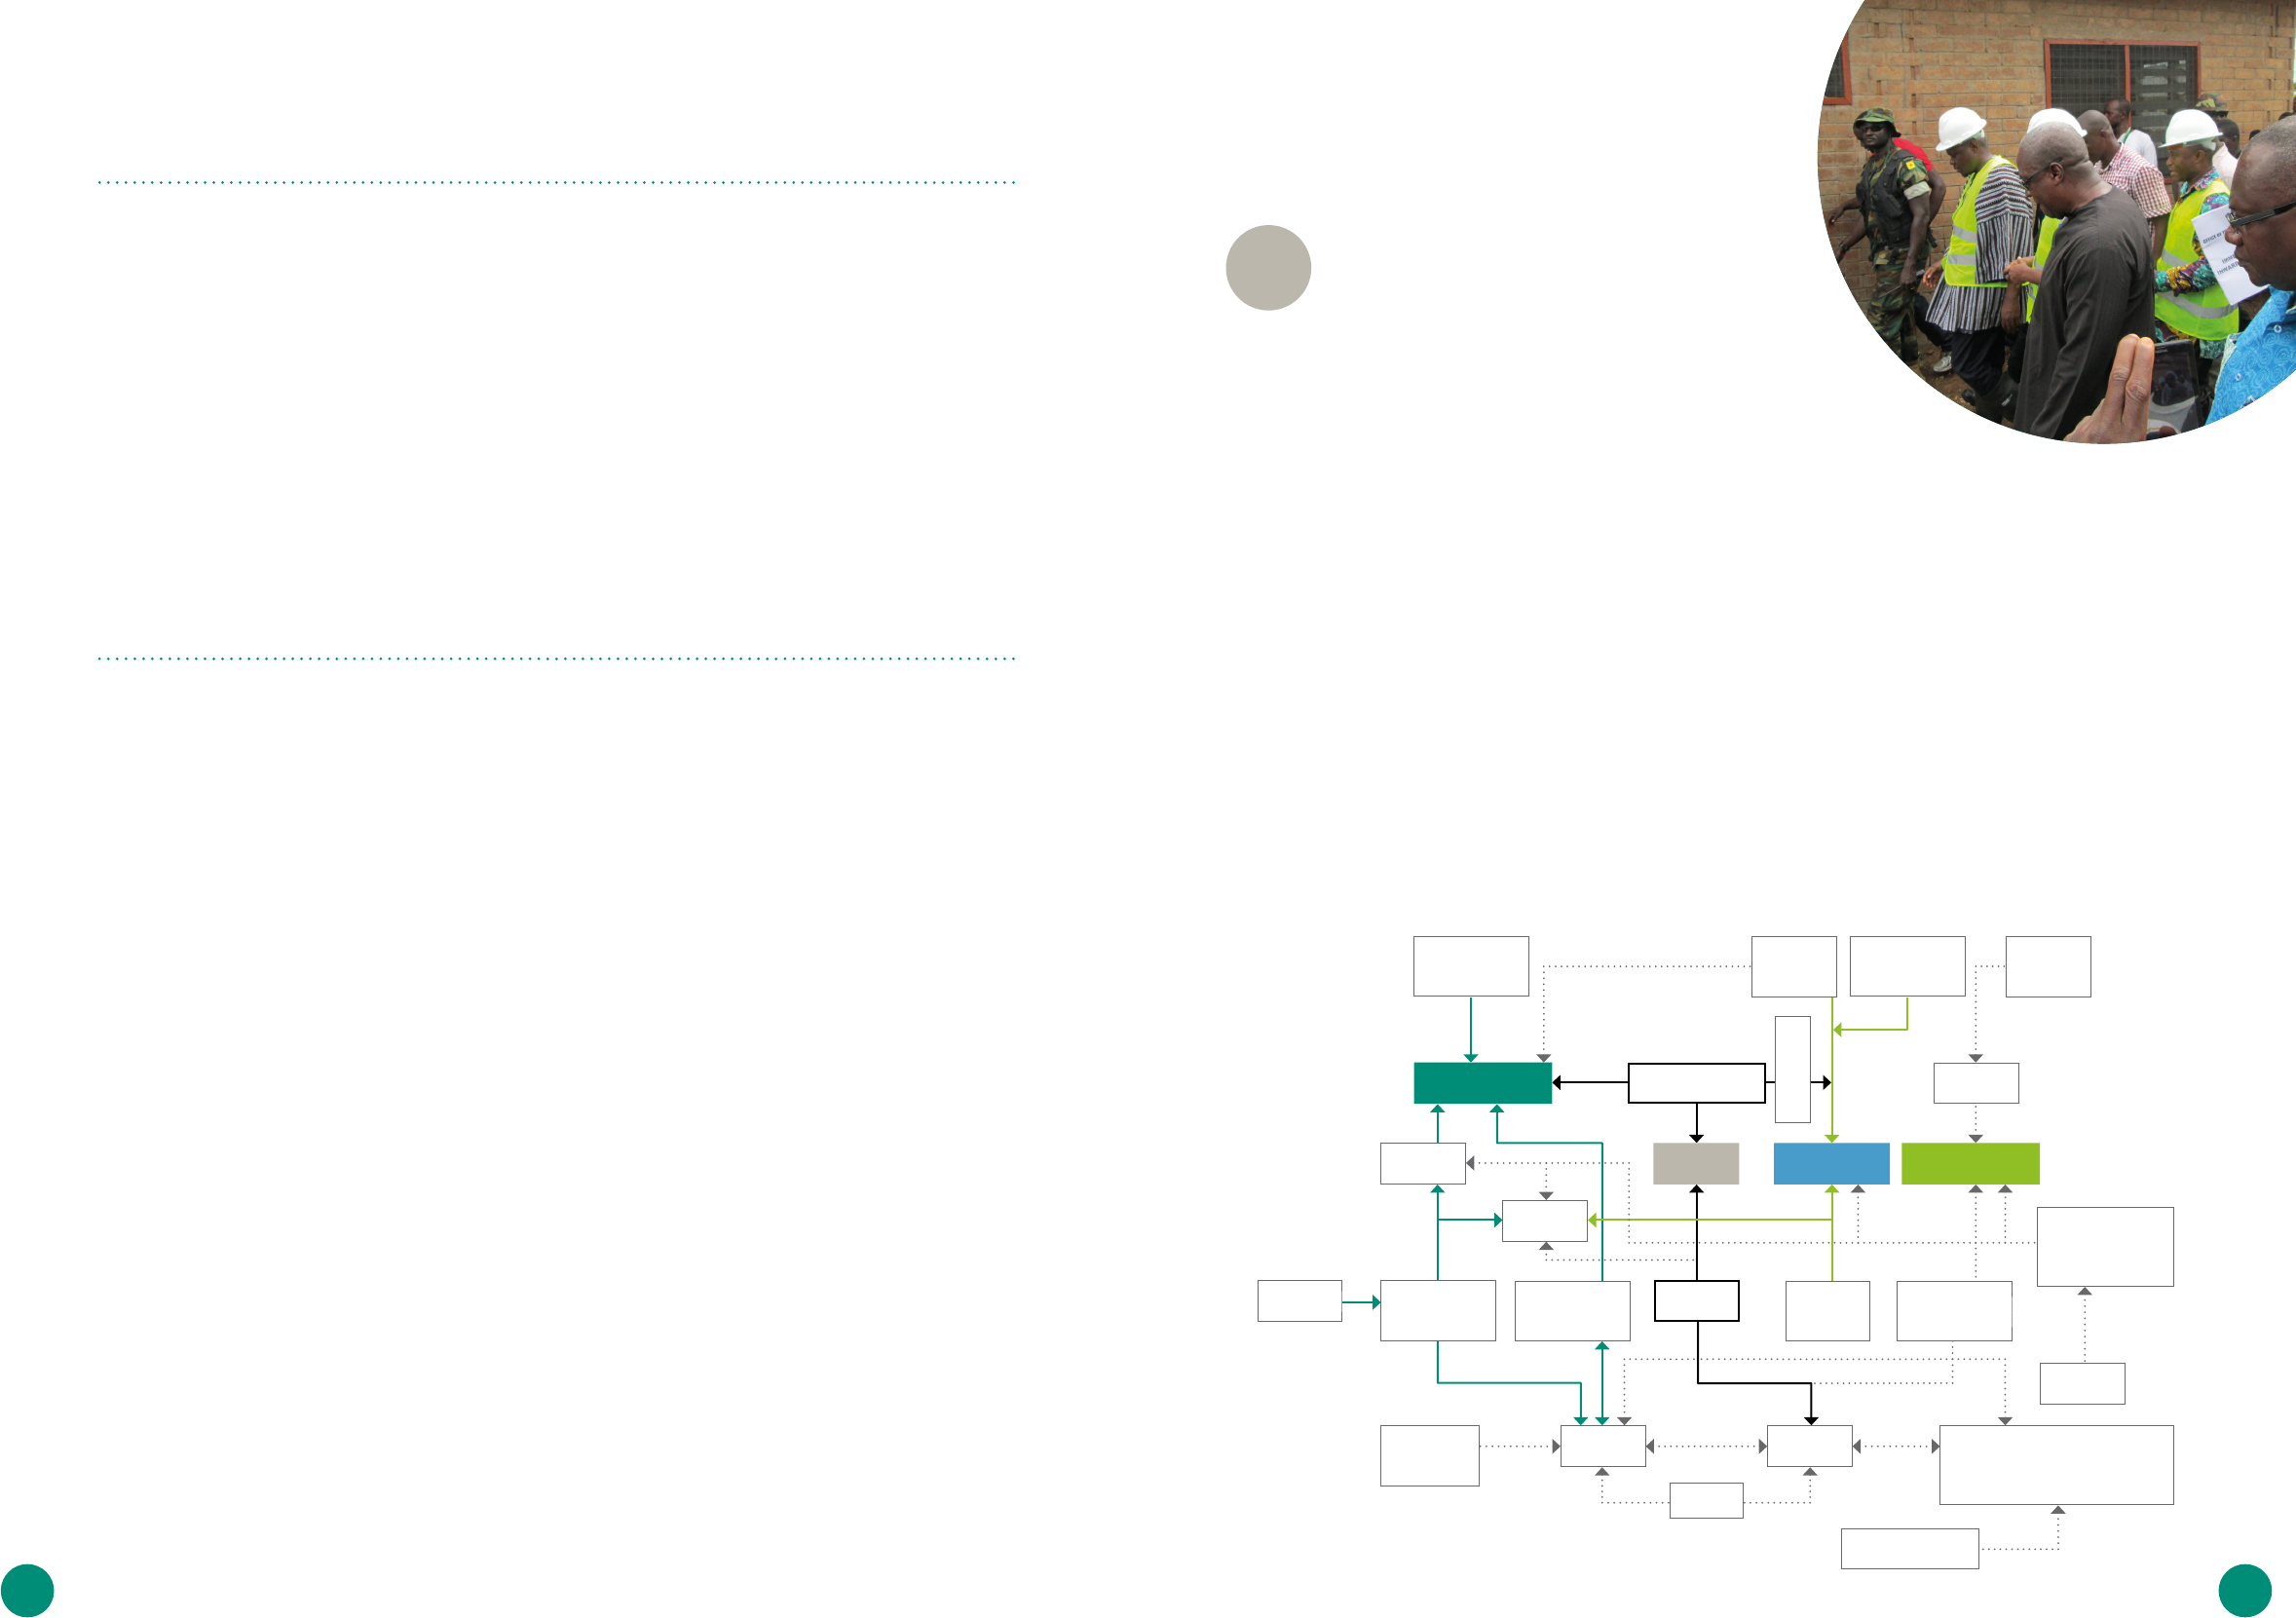
4746
I
n recent years’ remittances from abroad, in
particular from Europe and North America, have
begun to play a role in housing finance. Sent
to family members for diverse purposes, remittan-
ces are now Ghana’s third largest single source of
foreign exchange earnings after gold and cocoa. In
2011 total remittances
31
into the country amounted
to USD 2.2 billion, a figure that dropped slightly to
USD 1.97 billion in 2013. Although the proportion
of these remittances that is spent on housing is
unknown, remittances are an increasingly import-
ant factor in homeownership in Ghana (UN-HAB-
ITAT, 2011). Yeboah (2003), for instance, asserts that
Ghanaians living abroad now own half of the new
housing stock in Accra. However, given that the
proportion of remittances actually being spent on
housing has yet to be accurately quantified, it is
difficult to determine the real extent of self-finan-
ced housing in Ghana.
C
entral government makes budgetary alloca-
tions to the Ministry of Water Resources, Works
and Housing (MWRWH) according to the pro-
posed programmes in its medium-term expenditure
framework. The MWRWH also uses this framework
to determine how it allocates its annual budgetary
resources to specific areas. Often the World Bank and
UN-HABITAT contribute resources to augment these
budgets; however, their funding is project specific.
Since 2010 the MWRWH has adopted a land-bank
approach to affordable housing where it acquires
and banks (i.e. sets aside for later development)
large tracts of land. Private developers are permit-
ted to build on these lands free of charge on con-
dition that they provide a contractually specified
volume of affordable housing on the site.
REMITTANCES
PUBLIC BUDGETARY ALLOCATIONS, SUBSIDIES AND
COLLABORATIVE EFFORTS
To identify the various key stakeholders involved in affordable housing in
Ghana, the authors of this report have examined the housing sector in general
and the affordable housing in particular, focusing specifically on those involved
in, among other things, affordable housing policy, regulation, financing,
construction, and end-use.
R
egarding the functional relations existing
among stakeholders, Ghana’s 2015 National
Housing Policy (p. 28) acknowledges that,
‘institutional arrangements within the housing
sector remain fragmented, inconsistent with
existing regulations and inadequately funded.’ As
Figure 8 shows, multiple actors are involved in
the affordable housing sector – in construction,
financing, regulation, infrastructure installation
and service provision – and have varying roles and
functions.
Key stakeholders
in the affordable
housing market
9
Environmental
protection agency
Traditional
council
Research
institutions
Land
Commission
Judiciary
Ministries,
departments
and agencies
Local authority
(metropolitan/municipal/district
assemblies) town and country
planning departments
Ministry of
Finance
Ministry of Water
Resources, Works
and Housing
Public housing
agencies (SHC,
TDC, etc.)
Private
developers
(GREDA)
(Work-based/
locality-based)
cooperatives
Cement monopoly,
importers, local
building materials
manufacturers
Individual
developers
Private
consultants
Banks
Individual
housing
Private
estate
Post-land sharing
individual housing
Private
contractors
Civil servants
(mostly at the
director level)
Resident
international
community
Ghanaians
living
abroad
Pooled
savings
/MFIs
Cooperative
members
Single households/
extended families
Mass/institutional
housing projects
Figure 8 • IDENTIFIED HOUSING SECTOR STAKEHOLDERS IN GHANA
Photo: Prime-Stat SVC Ltd.
4948
This report has explored the dynamics of Ghana’s housing market and, in so
doing, has sought to provide information and pointers for private sector actors
that will enable them to better make the business case for developing affordable
housing schemes in the country.
D
eveloping affordable housing solutions in
Ghana is vital if the country is to success-
fully address not just its present acute
housing shortage, but also its future needs. At pre-
sent, formal private developers tend to focus their
schemes towards those in the top income bracket.
As such, they are failing to address large segments
of the market, leaving low-income people to get by
in low-quality and often overcrowded housing and
others to survive in Ghana’s numerous slums or
living on the streets. In quantitative terms, in 2010
over 27% of Ghana’s households were in need of
affordable housing.
Major factors that make it difficult for house-
holds to access quality and adequate housing are,
among others, land tenure issues, the high cost
of housebuilding, high interest on mortgages, and
low household incomes. These challenges vary
from one location to another: in the southern part
of the country, housing challenges are general-
ly linked to inadequate supply; in the northern
part, housing quality is the key issue. What is
true throughout Ghana, however, is that whatever
the housing solution devised, it must be flexible
enough to embrace the largely informal charac-
ter of income-generation and homebuilding in
Ghanaian society.
Conclusion
10
LEVEL ELEMENT STATE PRIVATE
COOPERATIVE/
COMMUNAL/INFORMAL
LAND MANAGEMENT
Lands Commission
judiciary system
Land Administration Project
(LAP) Internal Revenue Service
(IRS)
individual freehold (limited)
Land Secretariat of Chiefs,
Family and Clan Heads and
Elders
traditional councils
PLANNING
Town and Country Planning
Department
Tema Development Corporati-
on (TDC)
State Housing Company (SHC)
Land Use Planning and Ma-
nagement Project (LUPMP)
private developers
consultants
partnerships of chiefs/family
heads and surveyors/planners
Tema Housing Cooperative Society, (Amui Djor Cooperative, etc.)
Employee groups: IRS, Ghana Standards Board Staff Association,
Volta Aluminium Company Staff Housing Cooperative, Circle Neo-
plan Drivers’ Association
Professional groups: Ghana National Association of Teachers (GNAT),
Ghana Medical Association, Ghana Registered Nurses
Faith-based groups: Church of Pentecost (McKeown Investment Co.
Ltd), Assemblies of God
SERVICING
Department of Urban Roads
Ghana Water Company Ltd
Electricity Company, Ghana
TDC
Ministry for Local Government
and Rural Development’s Ur-
ban Infrastructure Projects
Metropolitan, Municipal and
District Assemblies’ (MMDA)
annual infrastructure extensi-
on plans
PS Global
Elite Kingdom
International Land Develop-
ment Company
-
FINANCE
Ministry of Finance and Econo-
mic Planning
the World Bank
UN-HABITAT
French Development Agency
(AFD)
etc. (for loans and grants)
Ghana Home Loans
Fidelity Bank
Ecobank
Other commercial banks
(for construction loans and
mortgages)
Savings groups
DEVELOPMENT
CONTROL
MMDAs’ works departments
police
National Disaster Management
Organisation
judiciary
- Land guards
HOUSEBUILDING
AND MAINTENANCE
SHC
TDC
Public Works Department
Social Security and National
Insurance Trust (SSNIT)
Architecture and Engineering
Services Ltd
GREDA
international developers
contractors
consultants
Individuals
prospective tenants
Water and Sanitation for Africa
HOUSING TENURE
Rent control department
courts
Foreclosure
Rent-free status (extended
family support)
FINANCE (LOCAL)
Bank of Ghana
SSNIT
Public Servants’ Housing Loans
Scheme Board
Ghana Home Loans
Fidelity Bank
microfinance banks
Ghana Microfinance Institu-
tions Network
Tier 3 Pension Scheme funds
life insurance funds
HFC Bank (reducing mortgage
operations)
Susu scheme
credit unions
Teachers Fund
Nurses Housing Fund
Ghana Federation of the Urban
Poor’s Housing and Land
Savings Scheme
the pooled funds of formal/
informal vocation-based and
other cooperatives
BUILDING
MATERIALS
Ghana Standards Board
the Mining sub-sector of the
Ministry of Lands and Natural
Resources
local steel tycoons (Kwasi
Oppong, etc.)
importers of tiles, glass and
plumbing fittings
Chinese warehousing/retailing
paints, pipes and plastics (part
import/ part local manufac-
turing)
aluminium sector (local manu-
facturers)
Cement:
Ghacem Ltd
Dangote Cement (re-bagging)
Imports from China, Turkey, etc.
Building and Road Research
Institute’s Pozzolana cement
sandcrete and landcrete block
production
brick and roof tile production
(small to medium-scale in-
dustry in Brong-Ahafo Region,
Winneba city, etc.)
sand and stone contractors
mining (informal)
Table 19 • INSTITUTIONAL ARRANGEMENT OF THE AFFORDABLE HOUSING SECTOR

5150
1
ANNEX 1: AVAILABLE LITERATURE ON HOUSING IN GHANA
32
Adjei, K. O., Fobiri, G. and Owiredu, G. K. (2015), ‘Policies and
Barriers in the Provision of Affordable Housing in Ghana’,
in: Mojekwu, J. N., Ogunsumi, L. O., Ojigi, L. M. Atepor, L.,
Thwala, D. W., Sackey, S., Awere, E. and Bamfo-Agyei, E. (eds),
African Journal of Applied Research, Vol. 1, No 1, Cape Coast,
Ghana, January 2015, pp. 159-169.
Adu, D. (2014), ‘The complex challenge of building a home
loans market in Ghana’, Private Sector and Development,
Proparco, France.
Angel, S. (2001), Housing Policy Matters. A Global Analysis,
Oxford University Press.
Arku, G. (2009), ‘The Economics of Housing Programmes in
Ghana, 1929-66’, Planning Perspectives, 24: 3, pp. 281–300.
Awanyo, L. (2009), ‘Meeting housing-space demand through
in situ housing adjustments in the Greater Accra Metropoli-
tan Area, Ghana’, Environment and Planning C: Government
and Policy, Vol. 27, pp. 302–318.
Bank of Ghana (2007), The Housing Market in Ghana.
Obeng-Odoom, F., 2011. ‘Real estate agents in Ghana: A sui-
table case for regulation?’, Regional Studies, 45(3), pp.403-
416.
Bank of Ghana (2016), Annual Percentage Rates and Avera-
ge Interest Paid on Deposits as at 30th September 2016.
https://www.bog.gov.gh/privatecontent/Public_
Notices/Banks%20APR%20and%20AI%20on%20depo-
sits-
Sept%202016.pdf (last accessed on 10 November 2016)
Konadu-Agyeman (2001), The Political Economy of Housing
and Urban Development in Africa: Ghana's experience from
colonial times to 1998. Praeger.
Korboe, D., 1992. Family-houses in Ghanaian cities: To be or
not to be?. Urban Studies, 29(7), pp.1159-1171.
Bezant, C. and Laufer, H. (2016), ‘Case Study: Housing Micro-
finance in Ghana’, Positive Planet Habitat III Side Event on
Housing finance or entrepreneurial building investment, 7
April 2016.
Boamah, N. A. (2010), ‘Housing Affordability in Ghana: A
focus on Kumasi and Tamale’, Ethiopian Journal of Environ-
mental Studies and Management, Vol. 3 (3).
Boamah, N. A. (2014), ‘Housing policy in Ghana: the feasible
paths’, GJDS, Vol. 11(1).
Broll South Africa, The Broll Report 2014/2015,
https://www.broll.com/publications/
CAHF (2012), Housing Finance in Africa Yearbook 2012, 2nd
edition, Centre for Affordable Housing Finance in Africa,
South Africa.
CAHF (2013), Housing Finance in Africa: A review of some
of Africa’s housing finance markets, Centre for Affordable
Housing Finance, South Africa.
CAHF (2015), Housing Finance in Africa; A Review of Some
of Africa’s Housing Finance Markets, Centre for Affordable
Housing Finance, South Africa.
GIZ (2014), My Home, Your Business – A guide to affordable
housing solutions for low-income communities, Bonn.
Gough, K. V. and Yankson, P. (2010), ‘A Neglected Aspect of
the Housing Market: The Caretakers of Peri-urban Accra,
Ghana’, Urban Studies Online, 1 August 2016.
GSS (2005), ‘Population Data Analysis Reports’, Policy Impli-
cations of Population Trends Data, Vol, 2, Ghana Statistical
Service, Accra.
GSS (2008), Ghana Living Standards Survey, Report of the
Fifth Round (GLSS 5), Ghana Statistical Service, Accra.
GSS (2012), 2010 Population and Housing Census Analytical
Report, Ghana Statistical Service, Accra.
GSS (2013), 2010 Population and Housing Census. National
Analytical Report, Ghana Statistical Service, Accra.
GSS (2014), Ghana Living Standards Survey, Report of the
Sixth Round (GLSS 6), Ghana Statistical Service, Accra.
Hulchanski, D. J. (2005), ‘Rethinking Canada’s housing
affordability challenge’, a discussion paper for the Govern-
ment of Canada’s Canadian Housing Framework Initiative,
Centre for Urban and Community Studies, University of
Toronto, Canada.
Jones Lang LaSalle (2012), Affordable housing in India: An
inclusive approach to sheltering the bottom of the pyramid.
Karley N. K. and Akomea, S. Y. (2007), ‘Overview and Pros-
pects of the Real Estate Market in Ghana’, 12th Asian Real
Estate Society Annual Conference and the 2007 AREUEA
International Conference, Wynn Resort, Macao, China, 9–12
July 2007.
Karley, N. K. (2008), ‘Ghana residential property delivery
constraints and affordability analysis’, Housing Finance
International, 22 (4), pp. 22–28.
Karley, N. K. and Akomea, M. S. Y. (2007), Overview and
Prospects of Real Estate Market in Ghana, Kumasi College
of Arts and Social Sciences, Kwame Nkrumah University of
Science and Technology.
Konadu-Agyeman, K. (2001.), The political economy of
housing and urban development in Africa: Ghana's Experi-
ence from Colonial Times to 1998. Prager Publishers
McBride, B., Majale, M. and Tsenkova, S. (2011), Affordab-
le land and housing in Africa, Adequate Housing Series,
United Nations Human Settlements Programme, Nairobi,
Kenya.
meQasa Ltd (2016), Accra Housing Guide, Accra,
https://meqasa.com/accra-housing-guide#land (up-
dated in January 2016; last accessed on 29 April 2016).
Ministry of Water Resources, Works and Housing (2015),
National Housing Policy, Accra.
Nkyi, B. A. and Dinye, R. D. (2013), ‘Accessibility to Real
Estate Finance in Ghana: Policy Directions for Stakeholder
Engagement in the Construction Industry’, International
Journal of Economics, Business and Finance, Vol. 1, No 3,
pp. 35–52.
O’Dell, W. O., Smith, M. and White, D. (2004), ‘Weaknesses in
Current Measures of Housing Needs’, Housing and Society,
31(1), 29–40.
PricewaterhouseCoopers (Ghana) Ltd. (2011), Ghana Banking
Survey. Sustaining growth: challenges and opportunities.
Sarfoh, K. O. (2010), Lost in Translation – the Nexus of
Multi-layered Housing Policy Gaps: The Case of Ghana, PhD
thesis, University of St Andrews, UK.
Shumann, R. and Miamidian, E. (2009), Housing Microfinan-
ce in Ghana, CHF International, Washington DC.
Tipple, G. (1996), ‘Housing Extensions as Sustainable De-
velopment’, Habitat International, Vol. 20 (3), pp. 367–376.
Tipple, G., Korboe, D., Willis, K. and Garrod, G. (1998), ‘Who
is building what in urban Ghana? Housing supply in three
towns’, Cities, Vol. 15, No 6, pp. 399–416.
Tweneboa, A. (ed.) (2011), ‘TAMSUF’s Role in Providing
Affordable Housing’, African Union for Housing Finance
Conference, Johannesburg, 7–9 September 2011,
http://www.auhf.co.za/wordpress/assets/TAMSUFS-RO-
LE-IN-PROVIDING-AFFORDABLE-HOUSING.pdf, (last
accessed on 6 May 2016).
UN-HABITAT (2004), Housing and urban development in
Ghana: with special reference to low-income housing,
Nairobi, Kenya.
UN-HABITAT (2008), Ghana – Overview of the current
housing rights situation and related activities, Nairobi,
Kenya.
UN-HABITAT (2010), Housing as a Strategy for Poverty Re-
duction in Ghana, Nairobi, Kenya.
UN-HABITAT (2011), Affordable Land and Housing in Africa,
Nairobi, Kenya.
UN-HABITAT (2011), Ghana Housing Profile, Nairobi, Kenya.
UN-HABITAT (2014), The State of African Cities 2014: Re-ima-
gining sustainable urban transitions, Nairobi, Kenya.
World Bank (2009), Housing Finance Policy for Emerging
Markets, Washington DC.
Yeboah, I. E. A. (2003), ‘Demographic and housing aspects of
structural adjustment and emerging urban form in Accra,
Ghana’, Africa Today, 50 (1), pp. 107–119.
5352
ANNEX 2: RELEVANT HOUSING INFORMATION ON GHANA
2
A conventional method for estimating housing
need is to assume a certain threshold per
house as the basis for ascertaining the scale of
the need. In Ghana’s 1987 National Housing Po-
licy, the objective was to reduce the threshold
of ten persons per unit to seven per unit. Using
a similar system to calculate housing demand,
the Bank of Ghana categorises houses with
8.7 or more persons to be overcrowded and
promotes an ideal limit of one household per
house.
The basis of this approach is to set a desirable
ceiling for the number of occupants per room.
For low-income housing, the 2015 National
Housing Policy suggests two persons per
room, a ceiling that also forms the basis for
the housing need assessment contained in the
policy document. UN-HABITAT’s 2014 Ghana
Housing Sector Profile also uses this threshold
approach for its housing need assessments.
To determine affordable housing demand in
this report, this approach was adopted, becau-
se, in both urban and rural Ghana, houses are
generally occupied by several households.
The first approach, which assesses occupancy
without taking into account family structure,
fails to address the culturally embedded
practice of nuclear and extended family
members cohabiting.
HOUSING NEED BASED ON DWELLING UNIT PER HOUSEHOLD
HOUSING NEED BASED ON ROOM OCCUPANCY THRESHOLDS
Box 5 • METHODOLOGIES FOR ESTIMATING HOUSING STOCK
NO YEAR GOVERNMENT INITIATIVES AND MAJOR ACTIVITIES
1
1957-66 Convention People’s Party
Tema Development Corporation (TDC) and the State Housing Corporation
(SHC) established
Rent control legislation put in place
Roof Loan Scheme and Wall Protection Scheme both launched
2
1966–69 National Liberation Council
Two-year development plan delivered through the TDC and SHC, with
1,000 units built
3
1969–72 Progress Party
2,000 housing units delivered by the SHC and TDC against a target of
8,000 units (the implementation plan did not indicate the typology of the
housing units in question and their associated costs)
Tema Housing Cooperative (THC) initiative established
4
1972–79
National Redemption Coun-
cil; Supreme Military Councils
I and II
National Low-Cost Housing Committee established
Low-Cost Housing Scheme operational (from 1972 to 1974)
5
1979 Armed forces
Rent control laws reinforced
State Houses Allocation Implementation Committee established
6
1979¬–81 People’s National Party
1,990 rental units delivered by the SHC and TDC
Table 20 • SUMMARY OF MAJOR GOVERNMENT HOUSING
INITIATIVES SINCE GHANA’S INDEPENDENCE
YEAR
1960 1970 1984 2000 2010
TOTAL NATIONAL
POPULATION
6,726,815 8,559,313 12,205,574 18,912,079 24,658,823
PERCENTAGE
INCREASE
- 27.2 43.7 53.8 30.4
GROWTH RATE
2.4 2.6 2.7 2.5 2.5
NUMBER OF
HOUSES
636,198 945,639 1,204,395 2,181,975 3,392,745
PERCENTAGE
INCREASE
- 48.6 27.4 81.2 55.5
NUMBER OF
HOUSEHOLDS
- 1,793,580 2,480,368 3,701,241 5,467,136
PERCENTAGE
INCREASE
- - 38.3 49.2 47.7
HOUSEHOLDS
PER HOUSE
- - - - 1.6
PERSONS PER
HOUSEHOLD
(URBAN/RURAL)
- 4,7 4,9 5,1 4,4
- - 4,1 5,0 4,3 5,2 4,7 5,4 4,1 5,0
PERSONS PER
HOUSE
10.6 9.1 10.0 8.7 -
Source: compiled using data from the Ghana Statistical Service (2005 and 2012).
Table 21 • CHANGES IN GHANA’S DEMOGRAPHICS AND HOUSING STOCK 19602010
NO YEAR GOVERNMENT INITIATIVES AND MAJOR ACTIVITIES
7
1981–93
Provisional National Defence
Council
World Bank Accra District Rehabilitation Project operational (1986–92)
SSNIT Mass Housing Estates (1987–2000) built
Draft of the National Housing Policy and Action Plan 1987–1990 (Novem-
ber 1986) prepared
Draft of the National Shelter Strategy (1987–92) prepared
GREDA and HFC formed in 1988 and 1990 respectively
8
1993–2000
National Democratic Con-
gress
Draft National Shelter Strategy (1999–2000) reviewed
World Bank Urban 2 to Urban Environmental Sanitation Project (UESP) 1
projects delivered with slum upgrading component
HFC bank Ghana Ltd established
SSNIT Workers’ Housing Schemes built in regional capitals and se-
condary cities
9
2001–2009 New Patriotic Party
Overseas Private Investment Corporation/USAID support the setup of
Ghana Home Loans (2006)
UN-HABITAT Slum Upgrading Facility put in place (2005 to present)
33
Review of the National Shelter Strategy initiated (2005 and completed in
2015)
International Finance Corporation’s Ghana Primary Mortgage Market
Initiative established (2007)
34
Affordable Housing Programme initiated in 2005 with an initial target
of 4,500 units and an ultimate target of 20,000 units – the Programme
failed to complete any units, so the project was subsequently handed
over to the TDC and SSNIT for completion
10
2012 to
present
National Democratic
Congress
Construtora OAS Ghana Ltd awarded contract to build 5,000 units in
Prampram – the first phase of 1,502 units is near completion
Phase 1 of the Slum Upgrading Project completed
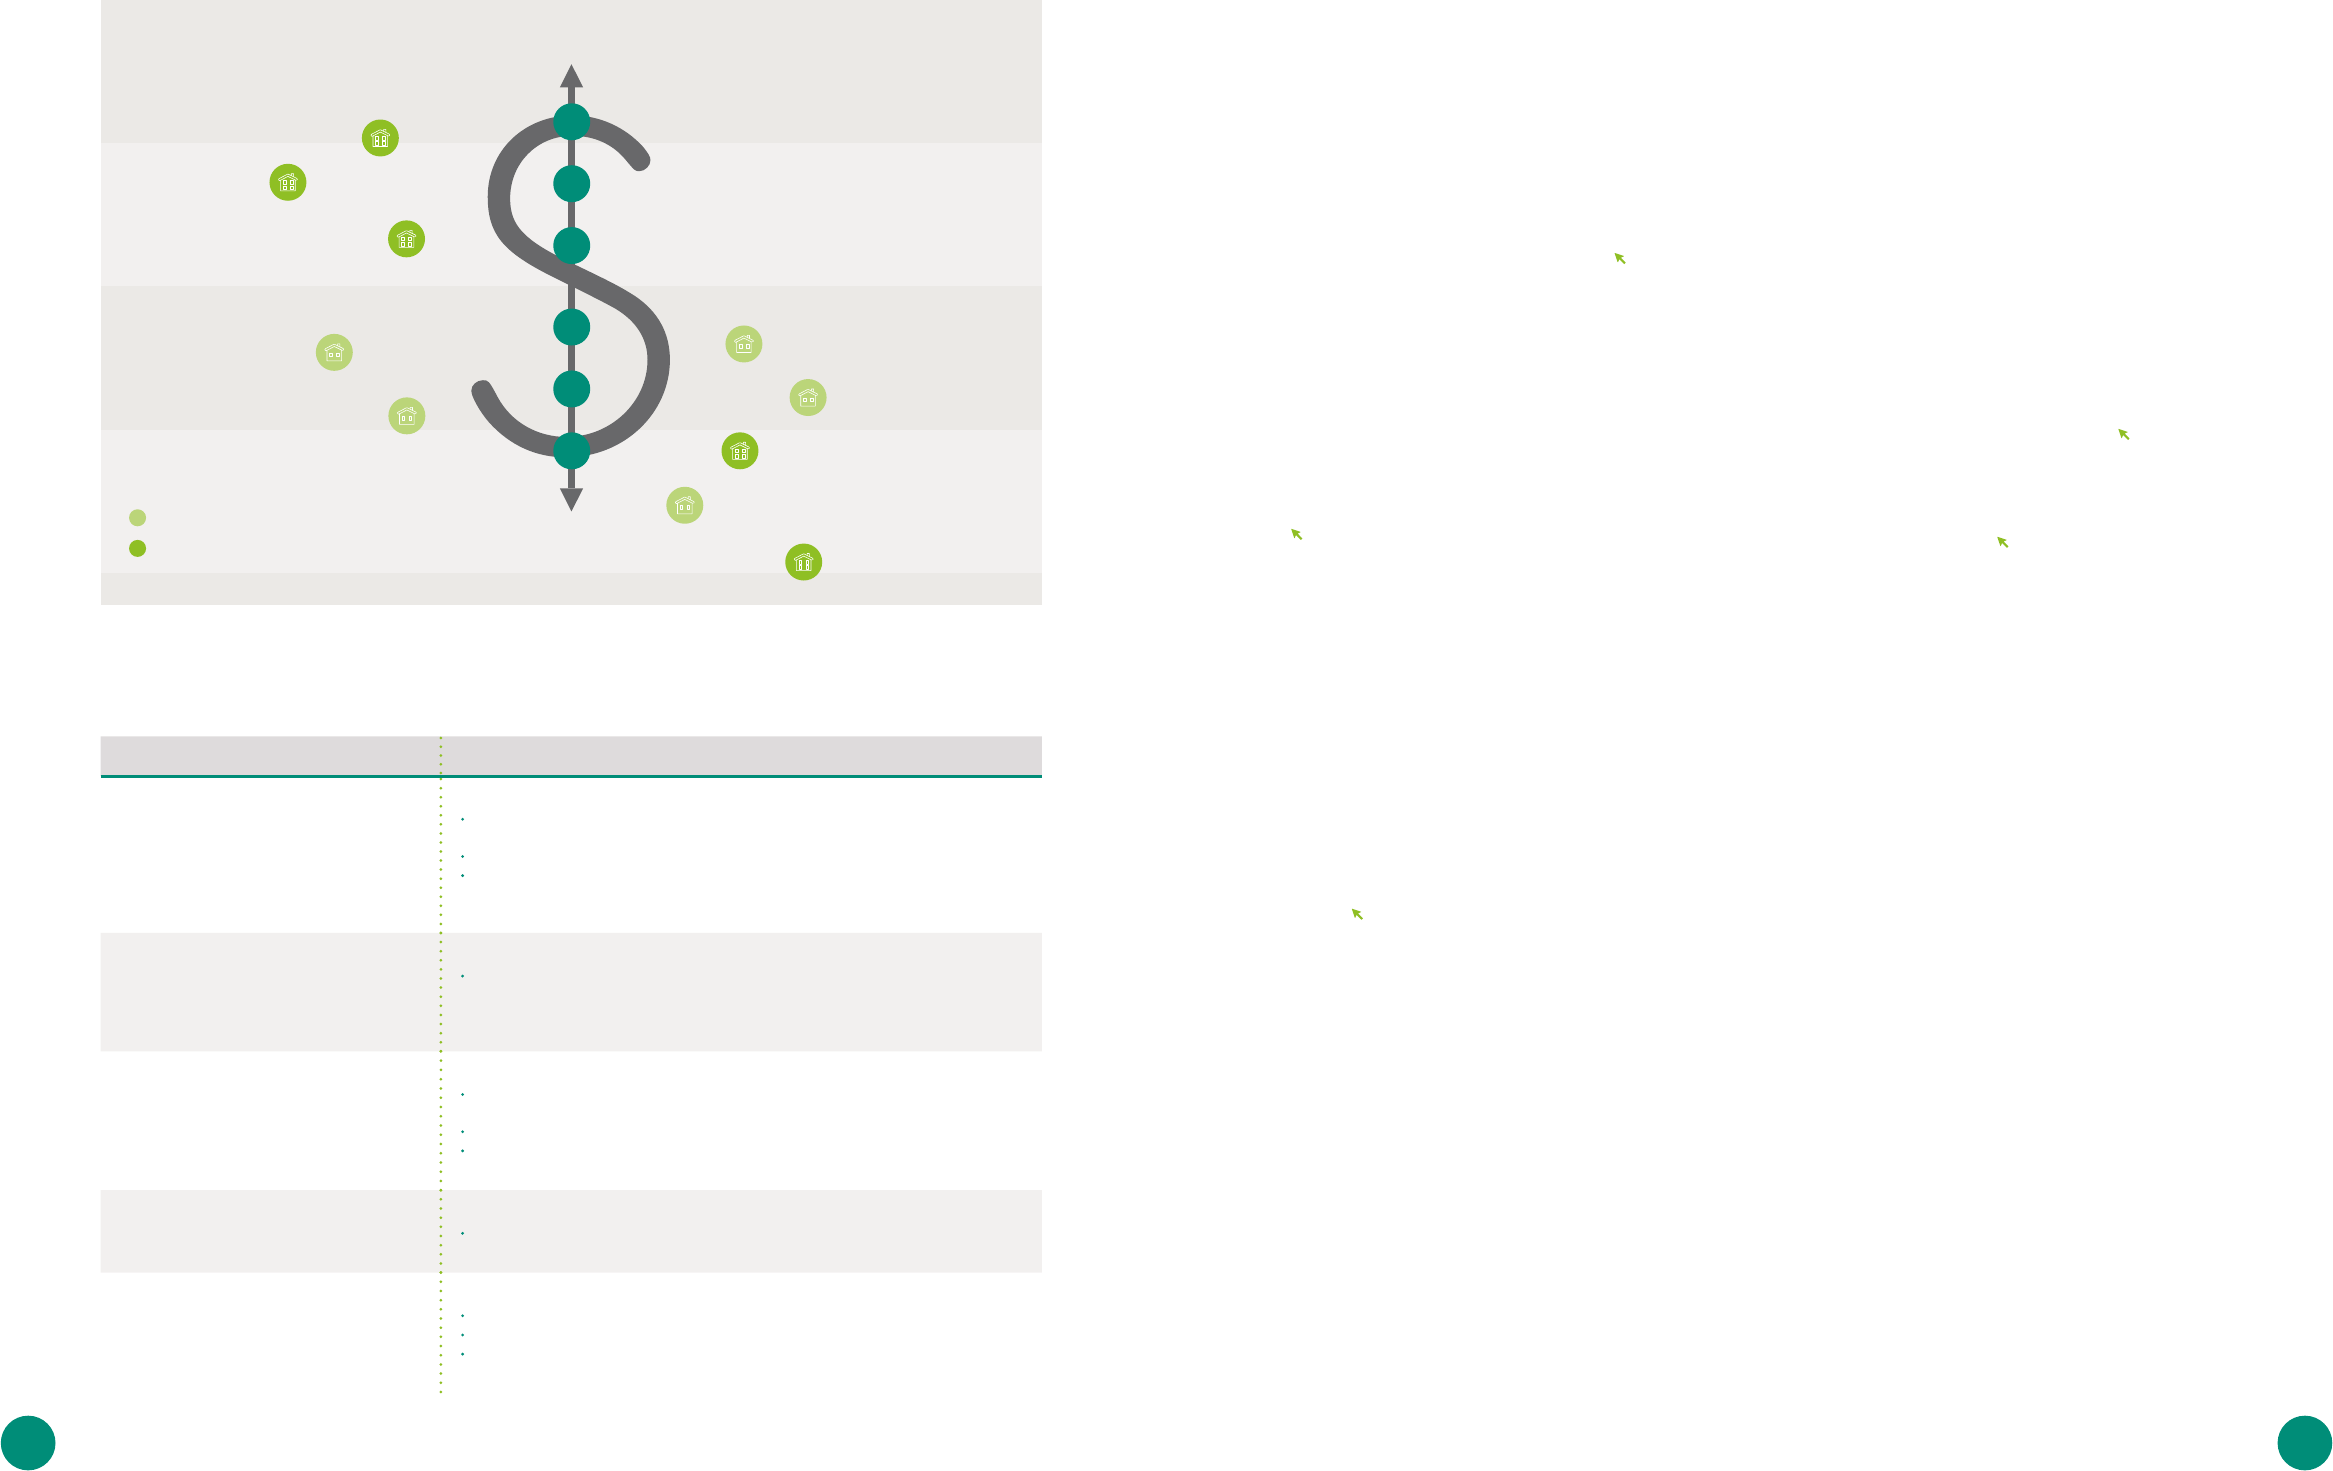
5554
KEY AREA
MAJOR CHALLENGES
LAND
High land acquisition and transaction costs, representing 15% of the total
development cost
Insufficient availability of developable lands
Multiple land ownership claims and litigations (thousands of land litigation cases
presently being processed by the courts)
SUPPORTING INFRASTRUCTURE
Absence of on-site infrastructure at many sites (both new and under development),
the installation of which comprises between 10% and 30% of the overall cost of the
development
BUILDING MATERIALS
Ghana is highly dependent on imports, with around 80% of materials currently
being imported
Inadequate R&D and local technology
Barriers to local alternative materials and absence of standards for local alternatives
FINANCE
High cost of borrowing (30% to 37% APR)
INSTITUTIONS AND GOVERNANCE
Fragmented policy and regulatory environment
Inadequate capacity – quality of craftsmanship, artisanal training
Data-poor environment
Table 22 • SUMMARY OF PRINCIPAL BARRIERS TO/ENABLERS
FOR AFFORDABLE AND INCLUSIVE HOUSING PROJECTS
FOOTNOTES
1 Unregulated market-based production of goods and services,
whether legal or illegal (Smith 1994).
2 The rational was not to sample respondents in a strictly
scientific way, but to form an impression of the affordable
housing market from a cross-section of stakeholders. The
terms of reference therefore set out an approach for obtaining
a sense of the local context of affordable housing and not for
producing a theoretically grounded body of research. Further-
more, the research was aligned to a similar approach used for
an earlier workshop delivered in Nigeria by the same team.
The measure of USD 2 per day was established by the World
Bank as the median poverty line for middle-income countries,
a category that Ghana now falls into (source:
http://www.
worldbank.org/en/news/press-release/2008/09/16/new-data-
show-14-billion-live-less-us125-day-progress-against-poverty-
remains-strong, accessed on 20 July 2016).
There is no consensus as to what constitutes low income. The
Ghana Housing Policy adopts a daily household income of USD
.
At present, it appears to be common practice among low-in-
come households to build as and when the household can
mobilise enough finance to complete a phase of home const-
ruction.
Areas with more than 5,000 inhabitants.
See the Ghana entry on PopulationData.net at
http://www.populationdata.net/?option=pays&pid=72&-
nom=ghana (accessed on 15th June, 2016).
On the graph the population growth rate appears not to show
any growth or decline. This is due to the scale used and the
very slight changes recorded.
The surveys for the GLSS 5 and GLSS 6 reports where conduc-
ted between September 2005 to September 2006 and October
2012 to October 2013 respectively.
The sharp contrast in the dominant building materials used
in rural and urban areas is highlighted in yellow.
The average household size reported in 2010 was 4.4 persons
per household. Thus, households occupying one or two rooms
is indicative of crowding levels and a deviation from the requi-
red 2 persons per room.
Perching generally refers to an arrangement where a per-
son/household moves in to join another household in their
living quarters, usually for a short term duration (on temporary
basis) while the former makes arrangements to relocate
(source:
http://microdata.worldbank.org/index.php/catalog/
/datafile/F/V, accessed on September ).
Annually in urban areas, –.
Depending on what metric is being measured: number of
dwellings, number of houses or number of rooms.
In the GLSS 6 report, housing expenditure is composite of
expenditure on housing and housing services; water, electricity
and gas. The same meaning is maintained in this section.
Some cells are black because the data is not captured in the
GSS reports
Some cells are black because the data is not captured in the
GSS reports
Using an exchange rate of GHS . to USD .
GHC refers to the Ghanaian Cedi (GHS) and R:Y refers to Rent
to Income ratio
Used as a proxy because the population and housing censu-
ses do not capture housing quality.
As at May, 2016 there were discussions to review the prices
per unit upwards as delays in project completion resulted in
cost increases.
Financed by Shack Dwellers International. People’s Dialogue
also provided transitional accommodation for would be resi-
dents while the housing units were built.
Housing brokerage is still embryonic and usually follow
informal word-of-mouth. Housing deconstruction is often as-
sociated with unauthorised buildings/structures and recycling
uncommon. As such the market potential of these stages can
be assumed to be limited and thus not detailed in this report
Overcrowding and the use of unconventional building mate-
rials are common features of Ghana’s slums.
Although it is acknowledged that households often prefer to
access loans for business investments rather than home impro-
vements, with the profits generated from the investment being
subsequently invested in housing (UN-Habitat 2011).
In 2008 the survey combined agricultural land with equip-
ment while it is not immediately clear the purpose of land
In May 2016, the bank reportedly offered 15.1% interest on
mortgages. The currently reported rate is unclear.
The country’s central bank, the Bank of Ghana, has just
issued an interim authorisation to Ghana Home Loans Ltd en-
abling it to operate as a universal bank (source:
http://www.
ghanaweb.com/GhanaHomePage/business/Ghana-Home-Lo-
ans-gets-banking-license-453399, accessed on 7 July 2016).
These figures are based on the outstanding balances of
loans rather than approved amounts.
This data was sourced from
http://static1.1.sqspcdn.com/
static/f/74284/25426256/1410346424887/C.E.O+Artice.pdf?to-
ken=K77WZKeTR6jn76RaKNXuO7VDuE4%3D (accessed on 14th
May, 2016).
This refers to remittances sent via the banking system. The
Bank of Ghana estimates that a certain amount is being sent
through other ‘illegal systems’.
NB: this list combines the bibliographical references for the
works cited herein with a catalogue of available literature on
housing in Ghana.
The programme has not being closed but no further invest-
ments have been made since the TAMSUF project.
Programme funds were not disbursed as planned due to
the global economic crisis. Subsequently in 2009, Ghana Home
Loans was given 10 million USD to boost residential mortga-
ge lending and provide better access to housing finance for
Ghanaian
The $ is the infographic denotes US dollars (USD)
Source: meQasa Ltd 2016.
35
RENTAL VALUES OF PROPERTIES DEVELOPED BY FORMAL
PRIVATE DEVELOPERS IN ACCRA IN JANUARY 2016
Prime
Neighbourhood
Average
Neighbourhood
$4.114.56
Cantoments
furnished
$4.035.59
Airport Res.
unfurnished
$3.171.53
Labone
unfurnished
$1.306.73
East Legon
furnished
$885.83
Dzorwulu
unfurnished
$1.442.64
Abelemkpe
furnished
$904.81
Spintex
furnished
$167.3
Achimota
unfurnished
$102.76
Dansoman
unfurnished
$395.59
Ashale Botwe
unfurnished
3-4 bedrooms
1-2 bedrooms
$500
$1k
$2k
$3k
$4k
$5k
PUBLISHED BY:
Inclusive Business Action Network
Deutsche Gesellschaft für
Internationale Zusammenarbeit (GIZ) GmbH
Registered offices
Bonn and Eschborn
Friedrich-Ebert-Allee 40
53113 Bonn
Germany
Tel. +49 (0)228 4460-0
Fax +49 (0)228 4460-1766
Dag-Hammarskjöld-Weg 1-5
65760 Eschborn
Germany
Tel. +49 (0)6196 79-0
Fax +49 (0)6196 79-1115
www.ib-an.net
Authors
Sarfoh, Kwadwo Ohene
Kavaarpuo, Godwin
Ayitio, Joseph
Reviewers and contributors
Alfred Berkoh
Ellen Oteng-Nsiah
Tony Asare
Farouk Braimah
Maja Rotter
Design/layout and typesetting
dithodesign.de
URL links:
Responsibility for the content of external websites
linked in this publication always lies with their respective
publishers. GIZ expressly dissociates itself from such content.
GIZ is responsible for the content of this publication.
Publication Date
November, 2016
On behalf of
Federal Ministry for Economic Cooperation and Development (BMZ)
