
Report to Congress
Annual Report
on Self-Insured Group Health Plans
Julie A. Su
Acting Secretary of Labor
March 2024
U.S. Department of Labor
2
Table of Contents
Executive Summary 3
Introduction 6
Section I. Required Form 5500 Group Health Plan Data 8
Number of Participants 10
New Plans 11
Benefits Offered 12
Funding and Benefit Arrangements 12
Plan Assets and Liabilities of Plans That Financed Benefits
t
hrough Trusts 14
Contributions, Investments, and Expenses of Plans That Financed
Be
nefits through Trusts 15
Section II. Additional Analysis of Financial Information on
E
mployers Sponsoring Self-Insured, Mixed-Insured, and Fully
Insured Group Health Plans 17
Section III. Conclusion 20

3
Annual Report to Congress on
Self-Insured Group Health Plans
Executive Summary
The Patient Protection and Affordable Care Act
1
requires the Secretary of Labor to provide
Congress with an annual report containing general information on self-insured employee
health benefit plans and financial information of employers that sponsor such plans. The
report must use data from the Annual Return/Report of Employee Benefit Plan (Form
5500), which many self-insured health plans must file annually with the Department of
Labor. The first report was provided to Congress in March 2011.
2
1
P.L. 111–148 (Mar. 23, 2010).
2
Available at https://www.dol.gov/sites/default/files/ebsa/researchers/statistics/retirement-bulletins/annual-
report-on-s
elf-insured-group-health-plans-2011.pdf. The 2012–2023 reports are also available online at
https://www.dol.gov/agencies/ebsa/about-e
bsa/our-activities/resource-center/reports. However, due to
changes to the algorithm and methodology beginning with the 2013 re
port, the reports are not comparable
over time.
Along with this report, the Department is submitting two detailed appendices:
• Appendix A, Group Health Plans Report: Abstract of 2021 Form 5500 Annual
Reports Reflecting Statistical Year Filings, provides detailed statistics describing
group health plans that file a Form 5500.
3
3
This work was conducted for the Department by the Actuarial Research Corporation (ARC) under
contract number 1605DC-19-F-00326.
• Appendix B, Self-Insured Health Benefit Plans 2024: Based on Filings through
Statistical Year 2021, explores statistical issues associated with Form 5500 health
plan data and analyzes available data on the financial status of employers that
sponsored group health plans and filed the Form 5500.
4
4
This work was conducted for the Department by Advanced Analytical Consulting Group (AACG) under
contract number 1605DC-19-C-0049.
This report presents data on health benefit plans’ Form 5500 filings covering private-sector
employees for statistical year 2021, the latest year for which complete data are available.
Approximately 81,800 group health plans filed a Form 5500 for 2021, an increase of 10
percent from 2020. Of those plans, about 46,100 were self-insured, and 4,500 mixed self-
insurance with insurance (“mixed-insured”). Self-insured plans covered nearly 35 million
participants and held more than $124 billion in assets, while mixed-insured plans covered
more than 33 million participants and held $164 billion in assets.
Table 1 summarizes aggregate statistics on plan counts, participants, and assets for self-
insured and mixed-insured group health plans that filed a Form 5500 for statistical years
2020 and 2021.

4
Table 1. Group Health Plans That Filed Form 5500, Statistical Years 2020 and 2021*
Plan Type
2020
2021
Self-
Insured
Plans
Mixed-
Insured Plans
Self-
Insured
Plans
Mixed-
Insured Plans
All Plans 37,900 4,400 46,100 4,500
Participants 35 million 29 million 35 million 33 million
Active Participants† 31 million 25 million 31 million 28 million
Large Plans‡ Not Holding
Assets in Trusts
19,200 3,500 19,300 3,700
Participants
23 million
21 million
23 million
25 million
Active Participants
22 million
19 million
22 million
22 million
All Plans Holding Assets in
Trust
18,800 900 26,800 800
Participants 12 million 8 million 11 million 8 million
Active Participants 9 million 6 million 9 million 6 million
Assets $112 billion $157 billion $124 billion $164 billion
Contributions $61 billion $74 billion $62 billion $74 billion
Benefits $58 billion $74 billion $61 billion $76 billion
NOTES: All figures in this table have been rounded.
* The Department defines a “statistical year” Form 5500 filing population as all Form 5500 employee
benefit plan filings with a plan year ending date between January 1 and December 31 of a given year.
† See
https://www.dol.gov/sites/dolgov/files/ebsa/employers-and-ad
visers/plan-administration-and-
compliance/reporting-an
d-filing/form-5500/2021-instructions.pdf.
‡ Plans with at least 100 participants.
SOURCE: 2020 and 2021 Form 5500 filings.
Self-insured plan sponsors pay covered health expenses directly (either from their general
assets or from a trust) as the plans incur claims. Fully insured plan sponsors generally pay
premiums to insurers that assume the responsibility of paying claims. Mixed-insured plan
sponsors retain claims-paying responsibility for some benefits but transfer the risk for the
remaining benefits to insurers, therefore financing benefits using a mixture of self-
insurance and insurance. Self-insurance is more common among larger group health plan
sponsors, in part because the health expenses of larger group health plans are more
predictable and, therefore, larger plan sponsors face less risk.
Self-insured and fully insured group health plans are governed by somewhat different rules.
For example, the Employee Retirement Income Security Act (ERISA) preempts state laws
regarding employee benefit plans, including health plans.
5
However, states have the right
to regulate the business of insurance and persons engaged in that business.
6
State insurance
laws may not deem an employee benefit plan to be an insurer, but states have jurisdiction
over issuers that provide fully insured plans with coverage.
5
ERISA section 514(a)
6
ERISA section 514(b)(2)(A)

5
Generally, health benefit plans covering private-sector employees must file a Form 5500 if
they have 100 or more participants. Regardless of size, plans must file a Form 5500 if they
hold assets in trust or are identified as a Multiple Employer Welfare Arrangement (MEWA)
or certain Entities Claiming Exception (ECE).
Most small (typically fewer than 100 participants), ERISA-covered group health plans do
not hold assets in trust and, therefore, are not required to file a Form 5500. As a result, a
large majority of small health benefit plans – including a significant but unknown number
of small, self-insured plans – are not included in this report.
The Department estimates that there were about 2.5 million ERISA-covered group health
plans covering approximately 134 million participants and beneficiaries in 2021.
7
Only
about 81,800 plans covering 83 million participants filed a 2021 Form 5500.
8
Of those
group health plans, about 35,700 (43.6 percent) filed at least one Schedule A (Insurance
Information) for a group insurance policy covering health benefits,
9
and roughly 28,200
plans (34.5 percent) reported holding assets and filed a Schedule H (Financial Information)
or Schedule I (Financial Information–Small Plan).
10
7
EBSA health plan estimates are based on the 2021 Medical Expenditure Panel Survey, Insurance
Component (MEPS-IC), and the 2019 County Business Patterns from the Census Bureau. Participant and
beneficiary counts for calendar year 2021 are from Table 1A of the Health Insurance Coverage Bulletin:
Abstract for the March 2022 Annual Social and Economic Supplement to the Current Population Survey,
https://www.dol.gov/sites/dolgov/files/EBSA/researchers/data/health-an
d-welfare/health-insurance-
coverage-b
ulletin-2022.pdf.
8
See Appendix A, Table A1.
9
See Appendix A, Table B1.
10
Statistics from Appendix A, Table A2, and ad-hoc tabulations produced by Actuarial Research
Corporation (ARC).
The Form 5500 does not collect data on plan sponsors’ finances.
11
However, financial data
for a subset of sponsoring employers that issue publicly traded equity or debt are available
from other sources.
12
The financial strength of these plan sponsors varies considerably.
Similar variation is found among employers that sponsor self-insured plans, mixed-insured
plans, and fully insured plans.
11
For multiemployer plans in particular, the plan sponsor is the association, committee, joint board of
trustees, or other similar group of representatives of the parties who establish or maintain the plan and
generally does not have finances separate from the plan.
12
The analysis in this report relies on Bloomberg data, which uses Form 10-K filings and other sources to
collect data on companies with public financial statements and generally includes companies with publicly
traded stock or bonds.

6
Introduction
Section 1253 of the Patient Protection and Affordable Care Act
13
requires the Secretary to
prepare an aggregate annual report that includes certain general information on self-insured
group health plans using data collected from the Annual Return/Report of Employee
Benefit Plan (Form 5500),
14
as well as certain data from financial filings of self-insured
employers.
13
P.L. 111–148
14
The following welfare plans, including group health plans, are not required to file a Form 5500, due to
statutory exemptions from ERISA or regulatory exemptions:
• we
lfare plans (other than plans required to file the Form M-1) with fewer than 100 participants as
of the beginning of the plan year (small plans) that are unfunded, fully insured, or a combination
of insured and unfunded;
• we
lfare plans maintained outside the United States that serve mostly nonresident aliens;
• go
vernmental plans;
• un
funded or insured welfare plans maintained for a select group of management or highly
compensated employees only;
• pl
ans maintained only to comply with workers’ compensation, unemployment compensation, or
disability insurance laws;
• we
lfare benefit plans that participate in a group insurance arrangement that files a Form 5500 on
behalf of the plan;
• ap
prenticeship or training plans meeting certain conditions;
• ce
rtain dues financed unfunded welfare benefit plans where certain reports are filed under the
Labor-Management Reporting and Disclosure Act;
• chu
rch plans; and
• welfare be
nefit plans maintained solely for the owner and/or spouse who wholly own a trade or
business or the partners and/or spouses of partners in a partnership.
A
small plan that (1) receives employee (or former employee) contributions during the plan year and does
not use the contributions to pay insurance premiums or (2) uses a trust or separately maintained fund to
hold plan assets or act as a conduit for the transfer of plan assets during the year is generally required to
file. However, a small plan with employee contributions that are used to pay benefits instead of insurance
premiums and is associated with a cafeteria plan under Internal Revenue Code section 125 may be treated
as an unfunded welfare plan for annual reporting purposes if it meets certain Department requirements.
(See 29 C.F.R. 2520.104-1 et seq.) In addition, plans that are MEWAs required to file the Form M-1 must
file the Form 5500, regardless of plan size. See
https://www.dol.gov/sites/dolgov/files/ebsa/employers-and-
advisers/plan-a
dministration-and-compliance/reporting-and-filing/forms/m1-2021.pdf.
There are three categories of plans: self-insured plans, fully insured plans, and mixed-
insured plans. Self-insured plan sponsors generally pay their plans’ covered health
expenses directly, as the plans incur claims. Fully insured plan sponsors typically pay
premiums to insurers, which then assume the responsibility of paying claims. Mixed-
insured plan sponsors are responsible for some benefits but transfer the risk for the other
benefits to health insurers—that is, they finance benefits using a mixture of self-insurance
and insurance.
The Form 5500 does not explicitly disclose whether a health plan is self-insured. However,
there are key qualitative differences between the three plan categories,
15
so the Department
15
Annual Report on Self-Insured Group Health Plans, Section III, What is a Self-Insured Group Health
Plan? (U.S. Department of Labor, March 2011). See

7
created an algorithm using filing characteristics to sort plans as self-insured, fully insured,
or mixed-insured.
https://www.dol.gov/sites/dolgov/files/EBSA/researchers/statistics/retirement-bulletins/annual-report-on-
self-i
nsured-group-health-plans-2011.pdf.
The methodologies for determining the plan universe for analysis and for determining
group health plans’ funding mechanism have periodically evolved since the March 2013
report. The Department has used its current methodologies to incorporate previous years’
data into this report to facilitate comparisons over time.
16
However, because of these
methodology changes, one cannot identify trends over time merely by directly comparing
the numbers in the reports.
16
Subject to the following criteria, the analysis for this report is based on health benefit plans that filed a
Form 5500 or Form 5500-SF.
1. Test filings, direct filing entity filings (including group insurance arrangements [GIAs], which can
onl
y file on behalf of participating plans if it is fully insured and uses a trust), duplicative filings,
and filings for “one-participant” retirement plans with health plan features have been removed
from the raw data set prior to analysis. Because some GIAs provide fully insured group health
benefits, the number of participants receiving fully insured group health benefits that are covered
by Title I of ERISA and reported on the Form 5500 may be understated. Information on the 49
Health GIAs that filed in 2021 is found in Appendix A of this report.
2. “Voluntary” filers (i.e., those that appear to meet the exception from the requirement to file based
on
the information provided, but still filed) have been excluded from the analysis. Filers with
fewer than 100 beginning-of-year (BOY) participants and no assets held were dropped from the
universe, including those with the following fields equal to zero or left blank on their Form 5500-
SF or Schedule I or H:
a. Beginning/End-of-Y
ear Assets, Liabilities, and Net Assets
b. Income, Expenses, and Net Income
3. For Form 5500-SF filers with fewer than 100 BOY participants and showing financial
information, we have assumed that it was an appropriate filing and that the plan must be self-
insured.
4. Terminating trusts and plans that file zero end-of-ye
ar (EOY) participants have been included.
5. For plans with missing EOY participants that are nonterminating, BOY participants have served as
a proxy for EOY total and active participants.
In some instances, group health benefits are offered through a plan that provides coverage
to the employees of two or more employers (and is not a collectively bargained
arrangement). Such a plan generally constitutes a MEWA under ERISA and is required to
file a Form 5500 regardless of size or holding of assets. The Department classifies and
reports plans according to their sponsor type: single-employer plans, multiemployer
17
plans, and multiple employer plans.
18
17
A “multiemployer plan” as defined in ERISA section 3(37) is a plan to which more than one employer is
required to contribute and which is maintained pursuant to one or more collective bargaining agreements
between one or more employee organizations and more than one employer.
18
Beginning with the Statistical Year 2017 filings, any plan that self-identifies as a multiple employer plan
is classified as a multiple employer plan. In addition, plans that identify as multiemployer plans are
reclassified as multiple employer plans if they report a business code of offices of physicians or dentists,
real estate, or legal services. Of the 81,800 group health plans in this year’s report, 878 were classified as
multiple employer plans. Of those, 276 were self-insured and 52 were mixed-insured.

8
Section I. Required Form 5500 Group Health Plan Data
Section 1253 of the Affordable Care Act requires the Department to submit information
on several data items from the Form 5500:
a) “general information on self-insured group health plans (including plan type,
number of participants, benefits offered, funding arrangements, and benefit
arrangements)”
b) “data from the financial filings of self-insured employers (including information
on assets, liabilities, contributions, investments, and expenses).”
The Form 5500 data presented below in response to these requirements should be
carefully interpreted for several reasons.
19
19
See the section titled “The Definition of Self-Insurance” in Appendix B for a detailed description of the
Department’s method for estimating whether group health plans are self-insured, fully insured, or “mixed-
insured,” based on the Form 5500 data.
• The Department has information for these data items only for plans that are
required to file a Form 5500. Generally, group health plans covering private-
sector employees must file a Form 5500 only if they cover 100 or more
participants, hold assets in trust, or constitute a plan MEWA. Governmental and
church plans, regardless of size, are not required to file a Form 5500. Therefore,
information on such plans is not available in the Form 5500 data and is not
included in the statistics in this report.
• Self-insured welfare benefit plans, including group health plans, are generally
required to file financial information only about assets they hold in trust. Thus,
the aggregate financial statistics provided in this report are understated, as they do
not include health benefits paid directly from plan sponsors’ general assets. Of the
self-insured plans that filed a Form 5500 in 2021, 42 percent did not hold assets in
trust and therefore did not report financial information.
• In cases where a single plan provides several different types of welfare benefits,
health benefits provided under the plan may be reported together with certain
other welfare benefits, such as disability or life insurance benefits, on a single
Form 5500. This can make it difficult to determine how the different benefits are
financed and whether the group health component of the plan is self-insured or
fully insured.
20
As a result, the estimates presented here are subject to substantial
uncertainty.
20
See report, Strengths and Limitations of Form 5500 Filings for Determining the Funding Mechanism of
Employer-Provided Group Health Plans, at
https://www.dol.gov/sites/default/files/ebsa/researchers/analysis/health-and-wel
fare/strengths-and-
limitations-of-fo
rm-5500-filings-for-determining-the-funding-mechanism-of-employer-provided-group-
health-pl
ans.pdf for a discussion of the sensitivity of plans’ funding categorizations. This work was

9
conducted for the Department by Deloitte Financial Advisory Services LLP under task order number
DOLB109330993.
Table 2. Form 5500 Group Health Plans Summary Information, 2021 Statistical Year
Filings
Plan Type All Plans
Self-Insured
Plans
Mixed-
Insured
Plans
Fully Insured
Plans*
All Plans
81,800
46,100
4,500
31,200
Participants
83 million
35 million
33 million
15 million
Active Participants
73 million
31 million
28 million
14 million
Large Plans Not Holding Assets
in Trusts
53,600 19,300 3,700 30,500
Participants
61 million
23 million
25 million
13 million
Active Participants
56 million
22 million
22 million
12 million
All Plans Holding Assets in Trust
28,200
26,800
800
700
Participants
22 million
11 million
8 million
2 million
Active Participants
17 million
9 million
6 million
2 million
Assets
$303 billion
$124 billion
$164 billion
$15 billion
Contributions
$151 billion
$62 billion
$74 billion
$15 billion
Benefits
$151 billion
$61 billion
$76 billion
$15 billion
NOTES: All figures in the table have been rounded. Totals may not equal the sum of the components due
to rounding.
* Plans that report benefit payments are classified as fully insured only if other information on the Form
5500 filing suggests that these payments were made to insurance companies for the provision of benefits
and not made directly to participants.
SOURCE: 2021 Form 5500 filings.
Plan Type by Funding Mechanism
Funding mechanism refers to the method a health plan uses to finance its benefits. Plan
sponsors may choose to pay for health services directly through the sponsor’s general
assets, with plan assets by purchasing insurance to cover benefit obligations, or some
combination. For the purposes of this report, the Department classifies those
arrangements as “self-insured,” “fully insured,” or “mixed-insured” respectively.
Of the self-insured group health plans:
• about 44,900 were sponsored by single employers,
• fewer than 1,000 were multiemployer plans, and
• fewer than 300 were multiple employer plans.
21
21
For certain Form 5500 reporting purposes, a “controlled group” or affiliated service group under Code
section 414(b), (c), or (m) is generally considered a single employer.
10
Of the mixed-insured group health plans:
• about 4,100 were sponsored by single employers,
• about 300 were multiemployer plans, and
• more than 50 were multiple employer plans.
22
22
See Appendix A, Table A2.
The number of group health plans that filed a Form 5500 increased by 10 percent
between 2020 and 2021. While both mixed-insured and self-insured plans increased, the
number of self-insured plans grew most significantly, at nearly 22 percent.
23
This growth
was largely driven by a 49 percent increase in filings of small, self-insured plans.
24
23
See Appendix A, Table A2.
24
See Appendix B, Table 18.
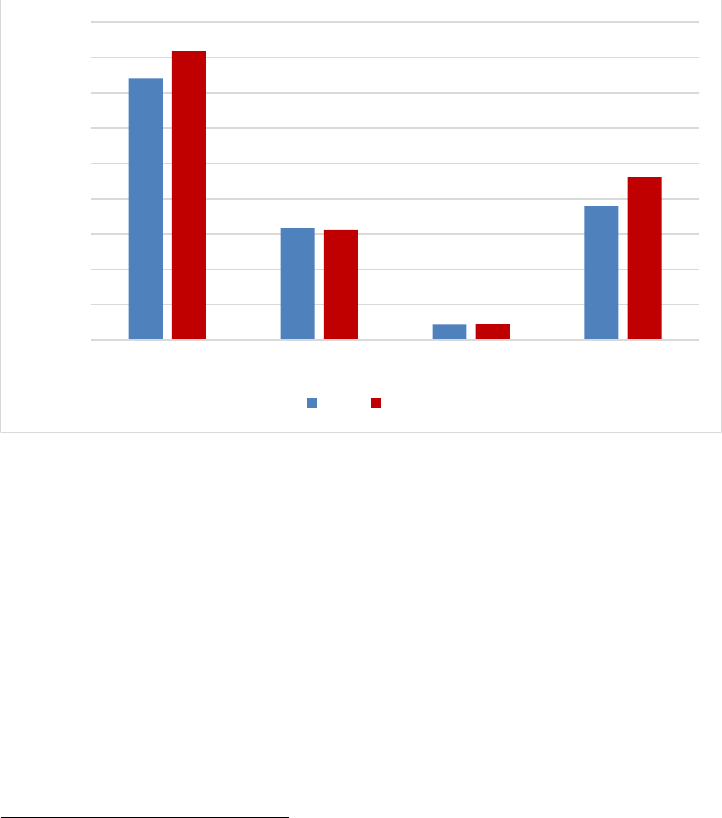
Figure 1. Group Health Plans that Filed a Form 5500, 2020-2021
Thousands
90
80
70
60
50
40
30
20
10
0
Total
74
82
Fully Insured
32
31
Mixed-Insured
4
5
Self-Insured
38
46
2020 2021
SOURCE:
Appendix B, Tables 7 and 18.
Number of Participants
The approximately 46,100 self-insured group health plans covered 35 million
participants, 31 million of whom were active participants. The 4,500 mixed-insured
group health plans covered 33 million participants, 28 million of whom were active
participants.
25
25
See Appendix A, Table A1.
Plans covering a larger number of participants are more likely to be self-insured or
mixed-insured than plans with fewer participants. While 54 percent of large plans were
fully insured, only 18 percent of participants were covered by large, fully insured plans.
26
26
See Appendix B, Table 5.
11
The number of plans and participants increased by more than 10 percent and nearly 6
percent, respectively, between 2020 and 2021. The distribution of participants by funding
type remained largely unchanged, however, with only mixed-insured health plans
showing modest growth in participants.
27
27
See Appendix B, Table 7 and Table 18.
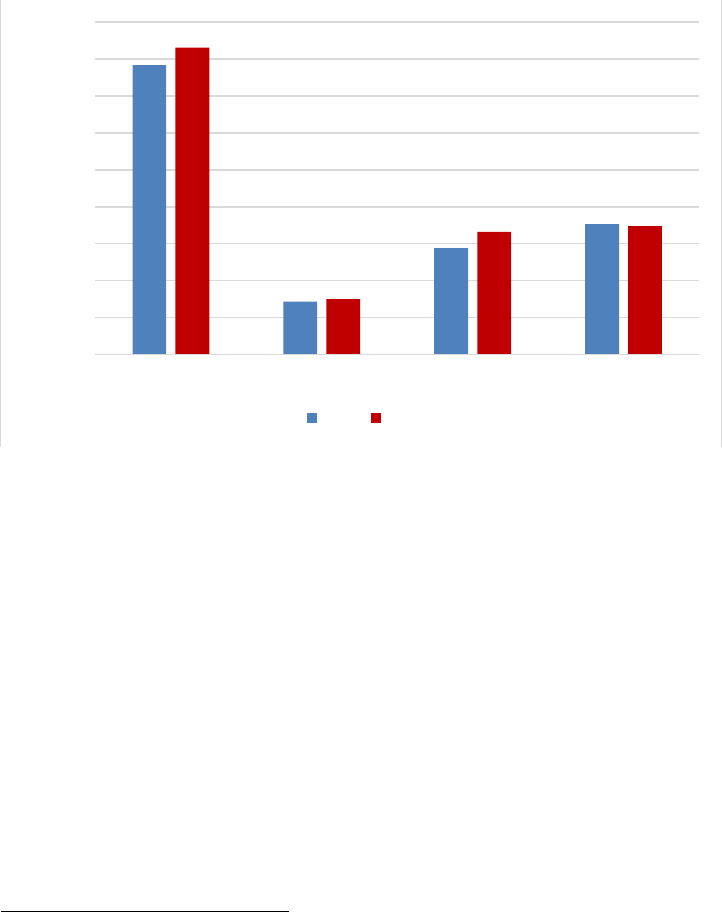
Figure 2. Participants in Group Health Plans that Filed a Form 5500, 2020-2021
Millions
90
80
70
60
50
40
30
20
10
0
Total
78
83
Fully Insured
14
15
Mixed-Insured
29
33
Self-Insured
35
35
2020 2021
SOURCE: Appendix B, Tables 7 and 18.
New Plans
New health plans are defined as health plans that checked the “first return/report filed for
the plan” box on their Form 5500 filing.
28
Of the roughly 11,600 new group health plans,
nearly 80 percent were small plans.
28
Beginning with the 2013 Self-Insured Report to Congress, plans were identified as “new” if they checked
the “first return/report filed for the plan” box on their Form 5500. Prior to this, plans were identified as
“new” if they could not be matched to a plan filing in a prior year, going back to 2001, regardless of
whether they reported the filing as their first filing. Consequently, the number of “new” plans in the current
Self-Insured Report to Congress is not directly comparable to the numbers reported in years prior to 2013.
While new, large plans tended to be fully insured (73 percent), new, small plans were
overwhelmingly self-insured (more than 99 percent), primarily due to an influx of filings
by small, self-insured plans that participate in non-plan MEWAs.
29
29
See Appendix B, Table 8 and Table 21.

12
Participants in new, large plans were split among funding types:
• 30 percent were covered by self-insured group health plans,
• 11 percent by mixed-insured group health plans, and
• 59 percent by fully insured plans.
30
30
See Appendix B, Table 8.
However, 69 percent of participants in new, small plans were covered by self-insured
plans.
31
31
See Appendix B, Table 21.
Benefits Offered
About 25,200 self-insured group health plans offered only health benefits, and nearly
20,900 offered health and other benefits.
32
32
Note that a health-only plan does not imply that the sponsor only offers health benefits. For example, the
sponsor could simultaneously offer a separate life insurance plan for which a separate Form 5500 filing
exists. This report does not include information on welfare plans that do not provide health benefits.
Of the 4,500 mixed-insured plans, 140 offered only health benefits, and nearly 4,400
offered health and other benefits.
33
33
See Appendix A, Table A1. Totals do not sum due to rounding.
Funding and Benefit Arrangements
Funding Arrangements
A funding arrangement is the method by which the plan receives, holds, invests, and
transmits assets that have not yet been used to provide benefits.
Among the self-insured group health plans, approximately:
• 1,600 indicated a trust-only funding arrangement,
• 1,600 indicated a funding arrangement of trust with insurance,
• 3,600 indicated funding from the sponsor’s general assets only,

13
• 15,000 indicated funding from the sponsor’s general assets combined with
insurance,
34
and
34
The majority of plans indicating a funding arrangement of general assets combined with insurance filed a
Schedule A (Insurance) for a nongroup health benefit. Alternatively, they were self-insured plans with stop-
loss coverage or plans that check box 9a on the Form 5500 indicating insurance, but did not file a Schedule
A.
• 24,000 indicated insurance alone,
35
some other combination of funding
arrangements, or did not report any arrangement.
36
35
Totals do not sum due to rounding. There were 477 of these plans that indicated “insurance alone” as a
funding arrangement in their filing but were characterized as “self-insured” for this report. However, these
plans also indicated stop-loss insurance, per-capita insurance premiums consistent with an administrative
services only (ASO) contract, attached a Schedule H or I that suggested a trust and self-insurance, or a
combination. As a result, the Department assigned a funding mechanism of “self-insured” despite the plan
indicating a funding arrangement of “insurance alone” for purposes of this report.
36
See Appendix A, Table A7.
Among the mixed-insured group health plans, approximately:
• 200 indicated a trust-only funding arrangement,
• 300 indicated a funding arrangement of trust with insurance,
• 3,600 indicated funding from the sponsor’s general assets combined with
insurance,
37
and
37
See Appendix A, Table A7. The 246 plans that were identified as mixed-insured and indicated a funding
arrangement of a trust only also filed a Schedule A (Insurance) and reported a health insurance contract.
Plans are deemed mixed-insured if the trust payments and the reported premium payments are more than 20
percent apart, if the percentage of participants covered by reported health insurance contracts is less than
50, or if the trust payments made directly to participants were substantial. (See Appendix B, pages 13–20)
• the remaining indicated insurance alone or some other combination of funding
arrangements.
38
38
See Appendix A, Table A7.
Benefit Arrangements
A benefit arrangement is the method by which the plan provides benefits to participants.
Among the self-insured group health plans, approximately:
• 1,000 indicated a benefit arrangement of a trust only,
• 2,200 indicated a benefit arrangement of trust with insurance,
• 3,300 indicated a benefit arrangement of the sponsor’s general assets only,
• 15,600 indicated a benefit arrangement of the sponsor’s general assets combined
with insurance,
39
and
39
The self-insured plans that listed a benefit arrangement of the sponsor’s general assets combined with
insurance may have filed a Schedule A for a nongroup health benefit or stop-loss coverage, or they may
have checked box 9a on the Form 5500 indicating insurance but did not file a Schedule A.
• 24,100 indicated insurance alone, some other combination of benefit
arrangements, or did not report any arrangement.

14
Among the mixed-insured group health plans, approximately:
• 600 indicated a benefit arrangement of trust with insurance,
• 3,700 indicated a benefit arrangement of the sponsor’s general assets combined
with insurance, and
• the remaining indicated insurance or trust alone, or some other combination of
benefit arrangements.
40
40
See Appendix A, Table A7. Totals may not sum due to rounding.
Stop-Loss Insurance
Self-insured plans may purchase stop-loss insurance to mitigate the risk of unexpectedly
large medical claims. Stop-loss insurance contracts protect against claims that are
catastrophic or unpredictable by covering claims costs that exceed a set amount for either
a single enrollee or for aggregate claims over a determined period.
If a sponsor purchases stop-loss insurance for its own benefit, the stop-loss insurance is
generally not required to be reported on Schedule A (Insurance). Accordingly, the
existence of stop-loss insurance as part of the sponsor’s arrangement for the plan is
understated in Form 5500 filings, especially for those plans that do not use a trust.
From 2012 to 2021, the percentage of large group health plans that reported having stop-
loss insurance gradually declined, from approximately 26 percent to 21 percent for self-
insured plans and from 20 percent to 16 percent for large, mixed-insured plans.
41
41
See Appendix B, Table 12.
It was markedly different for small group health plans. The percentage of small, self-
insured plans that reported having stop-loss insurance increased from 20 percent in 2012
to 48 percent in 2021, with a fairly steady growth throughout that period. The percentage
of small, mixed-insured health plans reporting stop-loss insurance ranged from 46 percent
to 69 percent from 2012 to 2021, though because of the small universe of these plans, the
annual share reporting stop-loss insurance tends to be volatile.
42
42
See Appendix B, Table 22.
Plan Assets and Liabilities of Plans That Financed Benefits through Trusts
Roughly 26,800 self-insured group health plans operated trusts, a 43 percent increase
compared with 2020. These plans reported $124 billion in assets (11 percent more than in
2020) and $12 billion in liabilities (a 5 percent increase compared with 2020).
About 800 mixed-insured group health plans financed benefits through trusts, a 17
percent decrease compared with 2020. These plans reported $164 billion in assets
(roughly 5 percent more than in 2020) and more than $21 billion in liabilities (14 percent
more than in 2020).
43
43
See Appendix A, Table A2.

15
Contributions, Investments, and Expenses of Plans That Financed Benefits through
Trusts
Contributions & Benefit Payments
Self-insured group health plans that financed benefits through a trust received
approximately $62 billion in contributions and paid approximately $61 billion in benefit
payments. Of the amount paid:
• $48 billion was paid directly to participants or beneficiaries,
• $6 billion was paid to insurance carriers for the provision of benefits,
44
and
44
Plans that self-insure health benefits may make payments to insurance companies for administrative
services, stop-loss contracts, or insurance premiums for other types of benefits (such as dental or
disability).
• $7 billion was reported as “other
45
” and cannot be categorized.
45
Instructions for the 2021 Form 5500, Schedule H state this category includes all payments made to other
organizations or individuals providing benefits. Generally, these are individual providers of welfare
benefits such as legal services, day care services, training, and apprenticeship services.
Mixed-insured group health plans that financed benefits through a trust received
approximately $74 billion in contributions and paid approximately $76 billion in benefit
payments. Of the amount paid:
• $58 billion was paid directly to participants or beneficiaries,
• $16 billion was paid to insurance carriers for the provision of benefits, and
• $2 billion was reported as “other” and cannot be categorized.
46
46
See Appendix A, Tables A4 and A5.
Administrative Expenses
Self-insured group health plans that financed benefits through a trust reported paying
about $4 billion in administrative expenses, with approximately:
• $500 million in professional fees,
• $1.4 billion in contract administrator fees,
• $200 million in investment advisory and management fees, and
• $1.7 billion in other administrative expenses
47
.
47
Instructions for the 2021 Form 5500, Schedule H state other administrative expenses may include
expenses for office supplies and equipment, cars, telephone, postage, rent, expenses associated with the
ownership of a building used in the operation of the plan, and all miscellaneous expenses.

16
Mixed-insured group health plans that financed benefits through a trust reported paying
about $4 billion in administrative expenses, with approximately:
• $400 million in professional fees,
• $1.8 billion in contract administrator fees,
• $500 million in investment advisory and management fees, and
• $1.4 billion in other administrative expenses.
48
48
Total for mixed-insured does not sum due to rounding. See Appendix A, Table A5.
Asset Holdings
The asset holdings reported by self-insured group health plans with 100 or more
participants and who financed benefits through trusts were composed of:
• 7 percent in cash,
• 7 percent in U.S. government securities,
• 21 percent in direct filing entities (DFEs),
• 27 percent in mutual funds (also known as registered investment companies),
• 10 percent in debt instruments, and
• 8 percent in stock.
49
49
DFEs are pooled investment arrangements, including master trust investment accounts, insurance
company pooled separate accounts, bank common/collective trusts, other plan asset pooled investment
funds (103-12 investment entities), and group insurance arrangements (GIAs). A Form 5500 must be filed
for a master trust investment account. A Form 5500 is not required for the other entities, but for plans to get
reporting relief with respect to those entities, the entity must file a Form 5500. Each DFE lists the plans
whose assets it holds on Form 5500, Schedule D Part 2.
The asset holdings reported by mixed-insured group health plans with 100 or more
participants and who financed benefits through trusts were composed of:
• 6 percent in cash,
• 16 percent in U.S. government securities,
• 12 percent in DFEs,
• 9 percent in mutual funds,
• 20 percent in debt instruments, and
• 6 percent in stock.
50
50
See Appendix A, Table A6.

17
Section II. Additional Analysis of Financial Information on
Employers Sponsoring Self-Insured, Mixed-Insured, and
Fully Insured Group Health Plans
Section 1253 of the Affordable Care Act requires this report to include data from the
financial filings of self-insured employers, including information on assets, liabilities,
contributions, investments, and expenses.
Data on the financial position of the plan sponsor or employer are not included in Form
5500 filings. In order to provide data on financial filings of self-insured employers, Form
5500 data were matched to Bloomberg financial data available for a select group of
companies with publicly traded equity or debt.
51
Analysis of financial measures – including
revenue, market capitalization, profit, and number of employees – shows that companies
offering self-insured or mixed-insured group health plans tend to be larger than companies
offering fully insured plans.
52
51
Appendix B outlines this analysis. Bloomberg is a provider of financial and other data for private and
public companies in the United States. The data include company characteristics, financial health, and
financial size. Prior iterations of this report used corporate financial data from Capital IQ, which is very
similar to Bloomberg data.
52
See Appendix B, Table 14, for the distribution of the measures for each of the three categories of plans.
The results of matching the 2021 Form 5500 data to the Bloomberg financial data were
similar to the results for 2020. Approximately 3,300 Form 5500 filers, or 6 percent of large
plans in the 2021 Form 5500 health plan data, were matched to the Bloomberg data.
Because the Bloomberg data represents mostly large, publicly traded companies that are
based in the United States, the findings cannot be generalized and applied to smaller,
privately held companies or employers participating in multiemployer or multiple
employer plans.
53
Of the participants in matched plans, 89 percent were covered through a
plan with 5,000 or more participants.
53
See Appendix B, Table 4. While this is a relatively small number, many companies that filed a Form
5500 are not represented in Bloomberg data because they may be exempt from publicly issuing financial
statements. Sponsors may be privately held, based overseas, or not-for-profit and without publicly issued
bonds; or the plan may be a multiemployer or multiple-employer plan.
Approximately 1,400 employers matched to a large, self-insured health plan. These plans
were sponsored by employers reporting a median employee count of nearly 7,000, a median
revenue of approximately $2.9 billion, a median market capitalization of approximately
$5.4 billion, and a median profit of approximately $208 million.
Approximately 1,000 employers matched to a large, mixed-insured health plan. These
plans were sponsored by employers reporting a median employee count of nearly 14,000,
a median revenue of approximately $5.1 billion, a median market capitalization of
approximately $10.1 billion, and a median profit of approximately $365 million.
54
54
See Appendix B, Table 14. Not all financial information for all employers was reported in the Bloomberg
data, so the number of observations used to calculate the reported medians varies significantly.

18
The matched companies’ financial health was measured using three financial metrics: the
ratio of profit to total debt, the ratio of cash and cash equivalent holdings to total debt, and
the Altman Z-Score.
55
The distribution of their scores was reported by plan funding type.
56
Overall, the results varied.
55
The Altman Z-Score is an index summarizing five financial measures that predict bankruptcy risk.
56
See Appendix B, Figure 12.
Employers sponsoring large, fully insured plans have more cash flow relative to total debt
than employers sponsoring mixed- or self-insured plans. As a result, a larger share of
employers sponsoring fully insured plans were in the top two categories of the cash/debt
measure than employers sponsoring either self-insured or mixed-insured plans. However,
a larger share of employers sponsoring fully insured plans had worse scores for operating
profit-to-debt ratio as well as worse Altman Z-scores than self-insured or mixed-insured
plans.
This variance makes it difficult to draw conclusions regarding a company’s financial health
and its choice of funding mechanism for its health plan, particularly as this analysis is
limited to large, publicly traded companies. It is noteworthy that, similar to prior years,
there was generally greater variation in the financial health of companies sponsoring fully
insured plans than self- or mixed-insured plans.
Plans filing a Form 5500 can also be matched across years to determine what changes the
plan has undergone over time. From 2012 to 2021, nearly 86 percent of plans, on average,
were matched to their previous years’ filing.
57
While plans may switch their funding
mechanism over time, less than 11 percent of large, established
58
plans do.
59
Large,
established plans that do change their funding mechanism status continue to move away
from being fully insured. Large, fully insured plans are more likely to terminate.
60
57
See Appendix B, Table 3. The analysis of small plan behavior over time is limited, as small plans may
stop filing because their funding changed or because they terminated.
58
For this purpose, “established plans” are those that did not indicate being initial or final filings on their
Form 5500.
59
See Appendix B, Table 10.
60
See Appendix B, Table 11.
The increasing number of self-insured and mixed-insured plans as well as the increased
share of participants covered by self-insured and mixed-insured plans may be explained by
several trends.
First, and most notably, new, small, self-insured plans continue to grow, driven by a large
number of small plans that participate in a MEWA. As a result, the majority of new plans
are self-insured.
61
61
See Appendix B, Table 8 and Table 21.
Second, large, established, fully insured plans are more likely to change their funding
mechanism or terminate than other large, established plans.
62
Although large, new plans
62
See Appendix B, Table 10 and Table 11.

19
are less likely to switch to self or mixed-insurance, there are considerably fewer new, large
plans overall.
63
Thus, large plans do move, on net, away from full insurance.
63
See Appendix B, pp. 26-27 for counts of “new” and “established” plans.
Lastly, the participant growth in mixed-insured plans seems to be driven, in part, by several
large, self-insured plans switching into the mixed-insured category, as well as one
particularly large mixed-insured plan that grew by more than 2 million participants
between 2020 and 2021.
20
Section III. Conclusion
This annual report provides the most detailed statistics currently available on self-insured
group health plans that filed a Form 5500 and on the sponsors of such plans that issue
publicly traded equity or debt. This report also documents the limited scope of such data
and the complexities involved in interpreting it.
The Department recognizes the importance of quality data and strives to further enhance
this report and its underlying statistics to continue to inform Congress about these plans
and their sponsors’ financial information.
