

i
SUMMARY
This document analyzes the funding mechanism of employer-sponsored health
benefit plans that filed a Form 5500 Annual Return/Report of Employee Benefit Plans
(“Form 5500”). It compares fully insured, mixed-funded, and self-insured health
plans for reporting periods that ended in 2016, and presents select historical series
for the years 2007 through 2016. For a subset of health plan sponsors, publicly
available corporate financial data were also used. The primary findings include:
Just under one-half of Form 5500 filing health plans (49%) were self-insured
or mixed-funded (funded through a mixture of insurance and self-insurance)
in 2016, and those plans covered 82% of plan participants.
At the plan level, the shares of self-insured (42%), mixed-funded (7%), and
fully insured (51%) plans are very similar to those of 2015.
In 2016, self-insured plans covered 46% of plan participants, mixed-funded
plans 37%, and fully insured plans 18%. (Percentages do not sum to 100%
because of rounding.) These shares reflect a small decrease in self-insurance
relative to 2015, but that change may be due to a definitional issue.
As reported in Form 5500 filings, stop-loss coverage among self-insured plans
declined from 30% in 2007 to 26% in 2010, flattened out at approximately
that level until 2015, and resumed its decline to 25% in 2016. Stop-loss
coverage among mixed-funded plans also declined—from 24% in 2007 to
below 17% by 2014—but increased slightly in recent years. These
percentages likely underestimate the overall prevalence of stop-loss
insurance.
Most Form 5500 filing plans with fewer than 100 participants were self-
insured in 2016. This is most likely due to Form 5500 filing requirements
rather than being representative of all small plans.
Among Form 5500 filing plans with 100 or more participants, the prevalence
of self-insurance generally increased with plan size. For example, 30% of
plans with 100-199 participants were mixed-funded or self-insured in 2016,
compared with 91% of plans with 5,000 or more participants. This is similar
to 2015.
Mixed funding is found primarily among very large plans. For example, 2% of
plans with 100-199 participants were mixed-funded in 2016, compared with
43% of plans with 5,000 or more participants.
Self-insurance rates varied by industry, with utilities, mining, agriculture, and
construction firms having the highest prevalence of self-insurance.
One-half (50%) of plans sponsored by for-profit organizations were self-
insured or mixed-funded, compared with 45% of plans sponsored by not-for-
profit organizations. Weighted by the number of participants, not-for-profit
organizations were much more likely to be self-insured and much less likely to
be mixed-funded than for-profit firms.
There is no consistent evidence that the financial health of fully insured plan
sponsors is better or worse than that of mixed-funded or self-insured
sponsors.

ii
CONTENTS
Summary........................................................................................................i
1. Introduction.............................................................................................1
2. Data Sources ............................................................................................2
Form 5500 Filings of Health Benefit Plans.......................................................2
Financial Information from IRS Form 990 and Capital IQ ..................................6
Matching Form 5500 Filings and Capital IQ Records .........................................8
3. The Definition of Self-Insurance ............................................................10
The Definition of Funding Mechanism Is Driven by Available Data.................... 10
Issues in Defining Funding Mechanism ......................................................... 12
Stop-Loss Insurance .................................................................................. 13
4. Analysis..................................................................................................14
Funding Mechanisms for Plans and Participants ............................................. 14
Funding Mechanisms by Plan Size................................................................ 15
Funding Mechanisms by Year ...................................................................... 17
Funding Mechanisms by Industry ................................................................ 19
Funding Mechanisms over the Life Cycle of Plans........................................... 20
Stop-Loss Coverage of Plans....................................................................... 30
Funding Mechanisms and Financial Metrics ................................................... 32
5. Conclusion..............................................................................................36
Technical Appendix .....................................................................................37
Disclaimer ...................................................................................................39

1
1. INTRODUCTION
The 2010 Patient Protection and Affordable Care Act (ACA) (§1253) mandates that
the Secretary of Labor prepare annual reports with general information on self-
insured group health plans (including plan type, number of participants, benefits
offered, funding arrangements, and benefit arrangements), as well as data from the
financial filings of self-insured employers (including information on assets, liabilities,
contributions, investments, and expenses). The U.S. Department of Labor (DOL)
engaged Advanced Analytical Consulting Group, Inc. (AACG) to assist with the ACA
mandate.
1
This document is intended to serve as an appendix to the Secretary’s
2018 Report to Congress.
As required by the ACA, the primary data source for this document is the information
provided to the DOL by health plan sponsors on Form 5500 Annual Return/Report of
Employee Benefit Plans (“Form 5500”) filings. For a subset of health plan sponsors,
publicly available corporate financial data were also used.
The current report analyzes Form 5500 filings for plan years that ended in 2007-
2016, i.e., several years before and after the enactment of the ACA in March 2010.
The primary findings for 2016 are similar to those for 2015, with a couple of
noteworthy updates: while self-insurance among plans generally decreased in recent
years, the slight increase first documented in last year’s report continued in 2016.
Weighted by plan participants, self-insurance halted its long-term increase, though
this may be due to a definitional issue (see footnote 23, page 17 for further
discussion).
The general approach and algorithm to determine funding mechanism are unchanged
from those in last year’s report.
Section 2 of this report describes Form 5500 and other data sources, including data
quality, consistency issues, and the extent to which financial data were matched to
health plan filings. Section 3 defines funding mechanism as used in this report.
Section 4 presents the results of our data analysis, and Section 5 concludes.
The views, opinions, and/or findings contained in this report should not be construed
as an official Government position, policy or decision, unless so designated by other
documentation issued by the appropriate governmental authority.
1
Deloitte Financial Advisory Services LLP (“Deloitte”) served as a subcontractor to
AACG in preparing the 2015-2019 iterations of this report. Conversely, AACG served
as a subcontractor to Deloitte for the 2011-2014 reports.

2
2. DATA SOURCES
The quantitative analysis in this report is based on three data sources: Form 5500
group health plan filings, Internal Revenue Service Form 990 Return of Organization
Exempt From Income Tax (“Form 990”) filings, and annual financial reports. This
section discusses the data sources and the algorithms to match the three sources.
Form 5500 Filings of Health Benefit Plans
The Form 5500 Series was developed to assist employee benefit plans in satisfying
annual reporting requirements under Title I and Title IV of the Employee Retirement
Income Security Act (ERISA) and under the Internal Revenue Code. The Form 5500,
including required schedules and attachments, collects information concerning the
operation, funding, assets, and investments of pensions and other employee benefit
plans. It is generally due, unless extended, by the last day of the seventh month
after the plan year ends (2016 Instructions for Form 5500).
ERISA requires any administrator or sponsor of an employee benefit plan subject to
ERISA to annually report details on such plans unless exempt from filing pursuant to
regulations issued by the DOL. Welfare plans with fewer than 100 participants
(“small plans”) are generally exempt, except if they operate a trust or are a plan
Multiple Employer Welfare Arrangement (MEWA). As a result, small welfare plans
that do not need to file a Form 5500 are not covered by the analysis in this report.
2
Also, non-ERISA plans, such as governmental plans and church plans, do not need to
file a Form 5500 and are not covered by the analysis in this report.
Benefits other than pensions are collectively referred to as welfare benefits.
Generally, separate Forms 5500 are filed for pension benefits and for welfare
benefits. This report centers on health benefits only, and is thus based on a subset of
welfare benefit filings.
3
The Form 5500 consists of a main Form 5500 and a number of schedules and
attachments, depending on the type of plan and its features. The main Form 5500
collects such general information as the name of the sponsoring employer, the type
of benefits provided (pension, health, disability, life insurance, etc.), the funding and
benefit arrangements, the effective date of the plan, and the number of plan
participants. If some or all plan benefits are provided through external insurance
contracts, Form 5500 plan filings must include one or more Schedules A with details
on each insurance contract (name of insurance company, type of benefit covered,
number of persons covered, expenses, etc.). If any assets of the plan are held in a
trust, a Schedule H or Schedule I must be attached with financial information.
Schedule H applies to plans with 100 or more participants, whereas smaller plans
may file the shorter Schedule I. Starting with the 2009 plan year, certain small plans
2
In 2016 the DOL estimated that 2,158,000 health plans cover fewer than 100
participants (Federal Register Vol. 81, July 21, 2016, page 47502). Our analysis
includes only 5,773 such plans (0.3%).
3
For the purpose of this report, only health benefits are relevant. However, 86% of
2016 Form 5500 health plan filings reported on both health and other types of
benefits (dental, vision, et cetera).

3
may file a Form 5500-SF (Short Form) with less detailed information.
4
This report’s
analysis includes 1,512 Form 5500-SF filings in 2016.
Some plans file a Form 5500 even though they are not required to do so. This report
excludes such voluntary filers from the analysis. Apart from this exclusion, our
analysis covers the universe (not a sample) of health plans that filed a Form 5500.
The analysis includes only one filing per year for plans that submitted multiple Form
5500 filings during a calendar year.
Table 1 presents the distribution of plan size, as measured by the number of
participants at the end of the reporting period, for filings in statistical year 2016, i.e.,
for filings with a reporting period that ended in 2016. Throughout this report,
participants may include active and retired employees, but will exclude dependents.
For 2016, the analysis is based on more than 56,000 plans that together covered
more than 75 million participants.
5
Table 1. Distribution of Health Plans and Health Plan Participants, by Plan
Participant Counts (2016)
Participants Participants
in p
lan
Plans Percent (millions) Percent
Zer
o
1,859 3.3% 0.0 0.0%
1-99 3,914 7.0% 0.2 0.2%
100-199 18,127 32.2% 2.6 3.5%
200-499 17,098 30.4% 5.3 7.1%
500-999 6,520 11.6% 4.5 6.0%
1,000-1,999 3,774 6.7% 5.3 7.1%
2,000-4,999 2,749 4.9% 8.5 11.3%
5,000+ 2,170 3.9% 48.7 64.8%
Tot
al
56,211 100.0% 75.2 100.0%
Source: Form 5500 health plan filings.
Not
e: Numbers may not sum to totals due to rounding.
4
To be eligible to use the Form 5500-SF, the plan must generally have fewer than
100 participants at the beginning of the plan year, meet the conditions for being
exempt from the requirement that the plan’s books and records be audited by an
independent qualified public accountant, have 100% of its assets invested in certain
secure investments with a readily determinable fair value, hold no employer
securities, not be a multiemployer plan, and not be required to file a Form M-1,
Report for Multiple Employer Welfare Arrangements (MEWAs) and Certain Entities
Claiming Exception (ECEs) for the plan year (2015 Instructions for Form 5500-SF).
5
The number of participants is based on the number reported in Form 5500 filings
and may overestimate the number of plan participants who receive health benefits. A
single Form 5500 filing may reflect multiple welfare benefit types/options available
under a single plan, and some participants may opt out of the health benefit option
but participate in a different welfare benefit option. For example, in a welfare plan
that provides multiple types of benefits, 500 employees may receive long-term
disability benefits while only 400 employees choose health benefits. The number of
plan participants reported on the Form 5500 would be 500.

4
As previously noted, health plans with fewer than 100 participants (small plans) are
generally not required to file a Form 5500 unless they hold assets in a trust. Small
plans in our analysis are thus a select subset of all small plans. In contrast, plans
with 100 or more participants (large plans) are generally required to file a Form
5500 unless otherwise exempt from filing, so we believe our analysis covers the vast
majority of large ERISA-covered plans in the United States.
Plans with fewer than 100 participants accounted for 10% of plans in our analysis.
6
Almost two-thirds of plans had between 100 and 499 participants. Most participants,
however, were in the largest plans. Plans with 5,000 or more participants make up
only 4% of all plans in our sample, but they account for 65% of all participants.
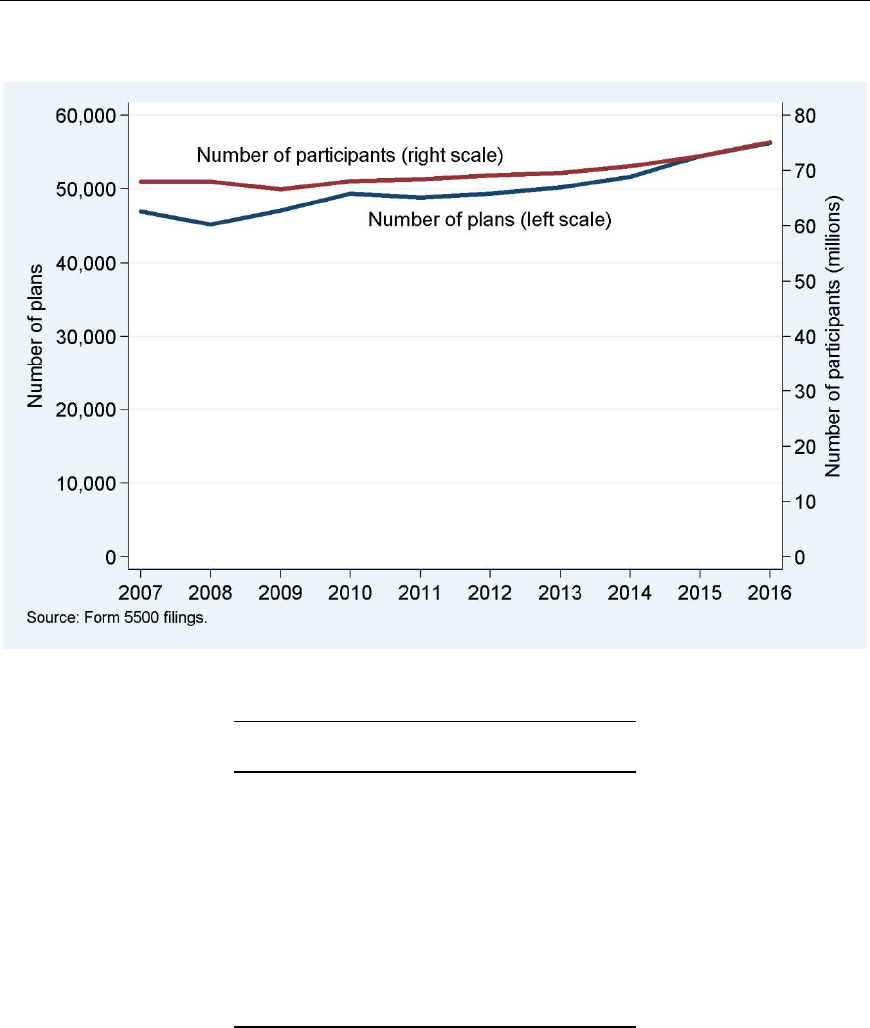
Our analysis covers statistical years 2007 through 2016. As shown in Figure 1 and its
underlying counts in Table 2, each statistical year includes between approximately
45,000 and 56,000 plans providing health benefits. The number of participants
ranged from approximately 63 million to 75 million per year. Between 2007 and
2016, the numbers of plans and plan participants have generally been increasing. An
exception was 2008, when the transition from paper to electronic filings may have
caused filings to be imperfectly captured.
7
The number of plans also decreased in
2011, shortly after the ACA was passed, but bounced back in 2012. The number of
plan participants did not drop in 2011, which could be consistent with plans that
terminated or otherwise ceased filing in 2011 being generally small, or the 2011
reduction in plan filings being in part due to plan mergers. Between 2015 and 2016,
the number of plans and participants grew by 3% to more than 56,000 and 75
million, respectively.
6
The filing exemption for plans with fewer than 100 participants that do not hold
assets in a trust is based on number of participants at the beginning of the year
(BOY), whereas Table 1 is based on end-of-year (EOY) participants. Some plans with
zero or 1-99 participants in Table 1 may be plans with more than 100 participants at
the beginning of the year and fewer than 100 (including zero) at the end of the year.
7
Prior to plan year 2009, Forms 5500 were generally filed on paper. Paper filings
were scanned and converted into an electronic database using a combination of
optical barcodes and optical character recognition. Starting with the 2009 plan year,
filers are required to file electronically using the ERISA Filing Acceptance System
(EFAST2).
5
Figure 1. Health Plans and Participants, by Statistical Year
Table 2. Health Plans and Participants, by Statistical Year
Statistic al Participants
year Plans (millions)
2007 46,936 68.0
2008 45,184 68.0
2009 47,104 66.6
2010 49,341 68.1
2011 48,855 68.4
2012 49,399 69.1
2013 50,227 69.6
2014 51,643 70.8
2015 54,488 72.6
2016 56,211 75.2
Source: Form 5500 health plan filings.
Table 3 shows the percentage of health plan filings that could be matched to their
corresponding filing in the previous year. While generally in the 83%-88% range,
this match rate was substantially lower in 2009, perhaps because of data capture
errors related to the then-new electronic filing requirement. In order to gauge
consistency in the reporting of the number of participants, the table also illustrates
to what extent participant counts of matched pairs of plans changed from one year
to the next. Table 3 shows that, at the median, plans reported approximately the
same size as in the prior year, suggesting that the matches are generally accurate
and that there is consistency in the reporting. Except in 2009, the distributions are

6
fairly stable over time and the interquartile range (the difference between the 75
th
and 25
th
percentiles) of plan size growth was about 15 percentage points.
Table 3. Distribution of Year-on-Year Participant Increases in Plans Matched
across Years
Number of Percentage
Statistical plans matched to a Year-on-year inc rease
year in year t plan in t-1 25th pct Median 75th pct
2007 46,936 84.8% -6.3% 0.8% 9.1%
2008 45,184 86.1% -7.7% 0.1% 8.2%
2009 47,104 79.7% -12.0% -2.1% 5.3%
2010 49,341 83.0% -8.6% -0.7% 6.1%
2011 48,855 87.8% -6.9% 0.0% 7.0%
2012 49,399 87.8% -5.8% 0.5% 8.1%
2013 50,227 87.5% -5.9% 0.5% 8.1%
2014 51,643 86.5% -5.6% 1.0% 9.1%
2015 54,488 84.6% -5.7% 1.3% 9.7%
2016 56,211 85.6% -6.1% 1.1% 9.5%
Source: Form 5
500 health plan filings.
Note: Match rates based on all Form 5500 health plan filings.
Participant increases based on the analysis sample only.
Financial Information from IRS Form 990 and Capital IQ
Several of our research questions seek to understand the relationship between a plan
sponsor’s financial health and the plan’s characteristics. To address these questions,
we matched Form 5500 health plan filings with two sources of financial information:
Form 990 and Capital IQ corporate financial data. We obtained plan sponsors’ not-
for-profit status from the Form 990 and some of their financial information from
Capital IQ. This section describes our approach and the number of Form 5500 filers
for which we achieved a statistical year 2016 match with the Form 990 or Capital IQ.
Not-for-Profit Status from Form 990
We determined whether health plan sponsors are for-profit or not-for-profit by
matching Form 5500 filings to Form 990 filings. We identify not-for-profit plan
sponsors by the existence of a Form 990 filing from the plan sponsor. Tax-exempt
organizations file a Form 990 annually with the IRS unless exempt from filing. The
IRS makes select fields of Form 990 filings, including Employer Identification
Numbers (EINs) and the organizations’ names, publicly available on its website. If
the corporate sponsor listed on a Form 5500 health plan filing was matched to a
Form 990 filing, and the entity that filed a Form 990 was not itself a benefit plan, we
identify the plan sponsor as a not-for-profit organization; otherwise, it is considered
for-profit.
8
8
Some welfare plans of for-profit corporations were themselves not-for-profit
entities. For example, the Form 5500 plan sponsor could be listed as XYZ
Corporation Employee Benefits Plan, a not-for-profit entity for which a Form 990 was
located. In such cases, we ignored the Form 990 entry for XYZ Corporation Employee

7
The match is carried out by EIN and organization name. To reduce mismatches due
to name spelling variations, we normalize names prior to matching, as discussed
below. The analysis sample for statistical year 2016 includes 56,211 filings of which
9,418 (17%) had sponsors that filed a Form 990 and were thus identified as not-for-
profit. They accounted for 15.2 million participants, or 20% of the total under study.
Financial Metrics from Capital IQ
Our financial metrics information comes from Capital IQ, a provider of financial and
other data for companies in the United States and elsewhere. Capital IQ culls Form
10-K filings and other sources to collect data on companies with public financial
statements, which generally includes companies with publicly-traded stock or bonds.
9
Our extract from its database contains information on the 2016 financial
performance for about 8,700 companies with public financial information whose
primary geographic location is in the United States.
We extracted fields that capture company characteristics, financial strength, financial
health, and financial size. In particular:
Market capitalization: total value of outstanding common stock as of the end
of the company’s financial reporting period;
Revenue: total revenue net of sales returns and allowances;
Operating income: revenue minus cost of revenues and total operating
expenses;
Net income: operating income net of interest expense, unusual items, tax
expense, and minority interest;
Cash from operations: total of net income, depreciation and amortization, and
certain “other” items;
Total debt: short-term borrowings, long-term debt, and long-term capital
leases;
Altman Z-Score: an index commonly used for predicting the probability that a
firm will go into bankruptcy within two years. The lower the score, the greater
the probability of insolvency; and
Number of employees.
Benefits Plan and looked for XYZ Corporation among Form 990 filings to determine
its for-profit status. To this end, we excluded Form 990 filings by Voluntary
Employees' Beneficiary Associations (VEBAs), Teachers Retirement Fund
Associations, Supplemental Unemployment Compensation Trusts or Plans, Employee-
Funded Pension Trusts, Multiemployer Pension Plans, and any filer with names that
include such labels as “health plan” or “welfare plan.” For-profit status thus refers to
the ultimate plan sponsor, not to the plan itself.
9
A Form 10-K is an annual financial report filed with the U.S. Securities and
Exchange Commission.

8
Matching Form 5500 Filings and Capital IQ Records
The only common field in Form 5500 health plan filings and the Capital IQ data
available to us is the company/sponsor name. In part because of spelling variations,
the match rate on name alone is low.
To obtain a better match rate, we used both EINs and company names. Form 5500
health plan data contain EINs, but the Capital IQ file available to us does not. Most
Capital IQ records, however, report the company’s Central Index Key (CIK), a
number used by the U.S. Securities and Exchange Commission (SEC) to identify
corporations and individuals who have filed a disclosure with the SEC. SEC filings,
electronically available from the SEC’s Electronic Data Gathering, Analysis, and
Retrieval (EDGAR) system, often include both a company’s CIK and its EIN. The CIK
can be used to link Capital IQ records to EINs from the SEC, and then the EIN can
link the Capital IQ-SEC record to Form 5500 filings.
10
Next, we defined clusters of EINs, CIKs, and company names that appeared to relate
to the same company. For example, a company may have used two EINs, or an EIN
may have been associated with multiple (similar) names. To improve the clustering,
we normalized the company names and removed plan labels (e.g., ABC Incorporated
Employee Benefit Trust is equivalent to ABC Inc.).
All related EINs, CIKs, and company names were mapped into a unique cluster ID.
Finally, we matched Capital IQ records and Form 5500 health plan filings by cluster
ID.
Corporate fiscal years need not correspond to health plan reporting periods. In an
effort to accurately match 2016 Form 5500 health plan filings with their sponsor’s
corresponding 2016 financial information, we required that the end date of the fiscal
year captured in Capital IQ and the end date of the Form 5500 plan year differed by
no more than 183 days. Only if the closest fiscal and plan years differed by no more
than 183 days did we consider this a match.
For example, a health plan sponsor could have a plan year from January 1 to
December 31, but a fiscal year that ran from April 1 to March 31 of the next year.
Under these circumstances, we would match the Form 5500 health plan filing ending
December 31, 2016 with the Capital IQ financial information for fiscal year ending
March 31, 2017.
Table 4 shows that we matched 3,918 plans, or about 7% of the plans in the 2016
Form 5500 health plan data.
11
This is the set of companies that appear in our
10
Some issues arose in the linking process. While about 15% of Capital IQ records
do not contain a CIK, 7% contain multiple CIKs. Also, some CIKs were found to be
linked to multiple EINs. These were incorporated in the analysis.
11
While this is a relatively small number, many companies that filed a Form 5500
are not represented in Capital IQ data because they may have no requirement to
issue publicly available financial statements. Sponsors may be privately held, based
overseas, or not-for-profit and without publicly issued bonds, or the plan may be a
multiemployer or multiple-employer plan.

9
matched analyses below. The 3,918 plans covered 27 million participants or
approximately 36% of all participants in the Form 5500 health plan data.
Table 4. Form 5500 Health Plan Filings Matched with Financial Information,
by Plan Size (2016)
Plans Participants
Num
ber of
Num
ber
par
ticipants
Num
ber
Per
cent
Mat
ch rate
(mi
llions)
Per
cent
Mat
ch rate
Zero 102 2.6% 5.5% 0.0 0.0%
1-9
9
124 3.2% 3.2% 0.0 0.0% 3.8%
100-199 410 10.5% 2.3% 0.1 0.2% 2.3%
200-499 678 17.3% 4.0% 0.2 0.8% 4.3%
500-999 533 13.6% 8.2% 0.4 1.4% 8.4%
1,000-1,999 564 14.4% 14.9% 0.8 3.0% 15.4%
2,000-4,999 640 16.3% 23.3% 2.1 7.7% 24.6%
5,000+ 867 22.1% 40.0% 23.4 86.8% 48.1%
Tot
al
3,918 100.0% 7.0% 27.0 100.0% 36.0%
Sou
rce: Form 5500 health plan filings and Capital IQ data.
Note: Numbers may not sum to totals due to rounding.
The match rate increases with plan size, presumably because large plans are
sponsored by large companies and larger companies are more likely to disclose
financial information than smaller companies. The match rate among plans with
5,000 or more participants is 40% (same as in 2015), i.e., more than one-half was
not matched. These include hospitals and universities without public financials, but
also plans sponsored by US operations of large international firms with public
financials. We restricted Capital IQ records to companies whose primary geographic
location is in the United States because the financial health of a foreign parent
company does not necessarily correspond to that of its US subsidiary. Mismatches
arose from differences between corporate names in Capital IQ (e.g., XYZ Holdings
Inc) and sponsor names on Form 5500 filings (e.g., XYZ Inc). A more inclusive name
matching algorithm could boost the matching rate, but it also increases the risk of
false matches which, in turn, could dilute any analysis results based on the matched
subset of plans. Instead, we opted for a more conservative approach with a smaller
subset of matched plans but more reliable matches.
12
12
The match rate for plans, 7.0%, is smaller than achieved using 2015 data (7.4%).
The reduction mirrors a decrease in the number of companies with public financials.
For example, the number of publicly listed companies dropped from 9,113 in 1997 to
5,734 in 2016 (“America’s Roster of Public Companies Is Shrinking Before Our Eyes,”
Wall Street Journal, January 6, 2017). Indeed, a manual review of large plan
sponsors that matched last year but not this year indicated that a substantial share
had merged with other companies, sometimes in conjunction with relocation
overseas.

10
3. THE DEFINITION OF SELF-INSURANCE
The Form 5500 does not require plan sponsors to specify the funding mechanism of
health benefits with sufficient specificity for us to determine whether plans that
report using both a trust and insurance should be classified for the purposes of this
report as self-insured, fully insured, or mixed funded. This section describes how we
determine funding mechanisms of individual plans for the purposes of this report.
The Definition of Funding Mechanism Is Driven by Available Data
As defined in this report, funding mechanism is based on information in Form 5500
health plan filings. Plans are categorized as self-insured, fully insured, or mixed-
funded. A mixed-funded plan contains both self-insured and fully insured
components. For example, an employer may offer its employees a choice between a
fully insured HMO option and a self-insured PPO option. If both plan components
were reported on a single Form 5500 filing, the plan would be mixed-funded. In
some cases, the data are incomplete or internally inconsistent. For example, while
Schedules A are intended to report on insurance contracts, some plans attached a
Schedule A for a contract that appears to be for administrative services only (ASO)
rather than for insurance. Given these limitations, the classification in this report
should not be interpreted as an official or legal definition. The definition of funding
mechanism is driven by available data. The data fields used by the algorithm are
provided in the Technical Appendix.
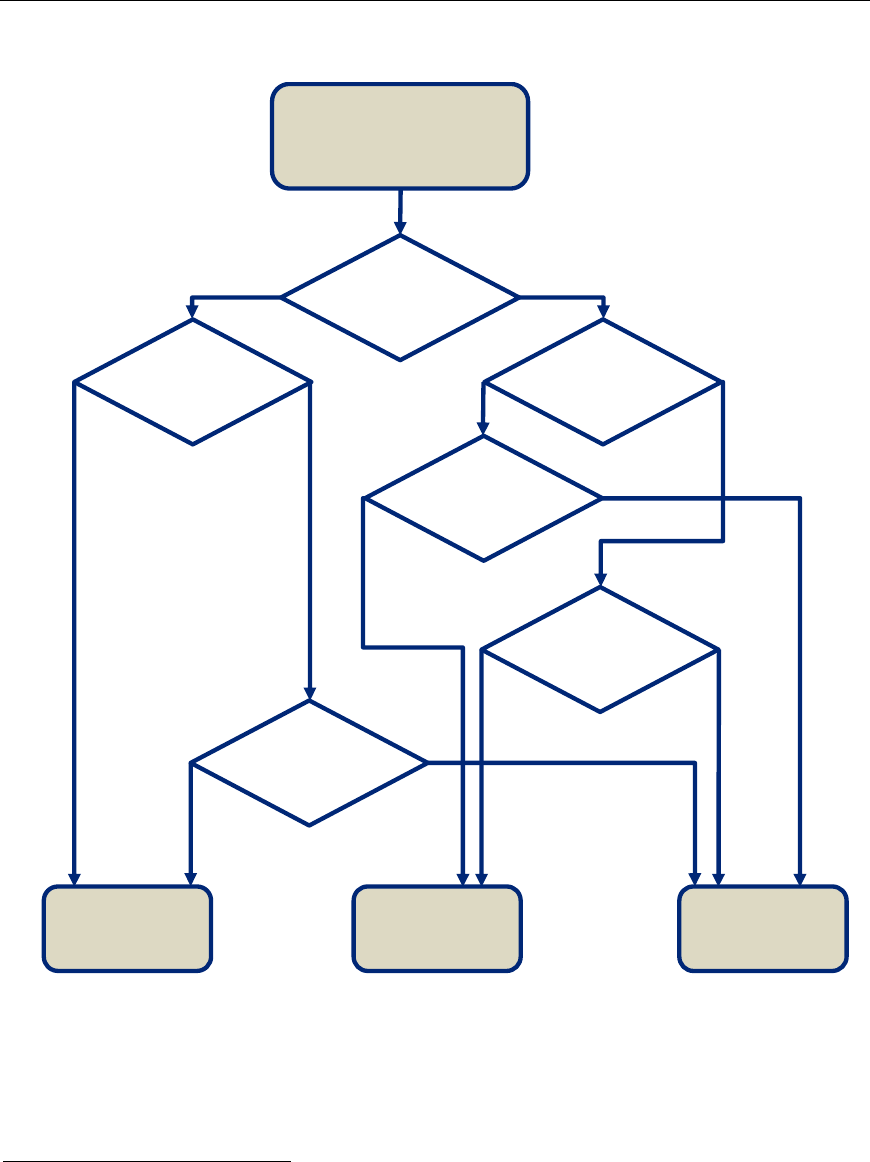
In 2016, 3,638 plans were identified as self-insured because they did not report any
health insurance contracts and the plan attached a Schedule H or I with evidence of
benefit payments; see Figure 2. Even though they did not attach a Schedule H or I,
another 20,066 plans were also identified as self-insured because they provided
other evidence of self-insurance: (1) the plan indicated that its funding or benefit
arrangement was, at least in part, through a trust or from general assets; (2) the
plan reported fewer than 100 participants and at least some financial information on
a Form 5500-SF;
13
(3) the plan reported 100 or more participants and non-zero
assets on a Form 5500-SF; or (4) the plan reported stop-loss coverage or payments
to a third-party administrator (TPA). In the absence of such evidence, 1,613 plans
were classified as fully insured. Some plans attached both a Schedule A with health
insurance payments, suggesting full insurance, and a Schedule H or I with trust
payments, suggesting self-insurance. For 318 of these plans, trust payments were
within 10% of payments for health or all insurance contracts, suggesting that they
used the trust to pass through insurance payments and that the plans were fully
insured; another 1,219 plans were classified as mixed-funded because their
insurance and trust payments were more than 10% apart.
13
Filers of a Form 5500-SF report financial information on the Form 5500-SF itself,
rather than on a Schedule H or I. We presume the following status for Form 5500-SF
filers:
Fewer than 100 participants, no financial information: voluntary filers,
excluded from the analysis;
Fewer than 100 participants, some financial information: self-insured;
100 or more participants, no assets: fully insured; and
100 or more participants, non-zero assets: self-insured.
11
Figure 2. Funding Mechanism Derivation
Self-Insured
23,704 plans
(42%)
Mixed-Funded
4,098 plans
(7%)
Fully Insured
28,409 plans
(51%)
Attached
Schedule A
?
Attached
Schedule H/I
?
No
Evidence
of self-insurance
?
Yes
Trust and
insurance payments
within 10%
?
No
Yes
Yes
Yes
No
3,638
plans
20,066
plans
2,879
plans
1,219
plans
1,613
plans
318
plans
26,478
plans
Total 2016 plans
56,211 plans
Attached
Schedule H/I
?
Yes
No
No
Yes
No
Insurance
covered <50% of
participants
?
In a common scenario, plans reported health insurance payments on one or more
Schedules A and did not file a Schedule H or I. For these plans, we compared the
number of people covered through health insurance contracts to the number of plan
participants. If the number of people covered by a health insurance contract was less
than 50% of the number of plan participants, we classified the plan as mixed
funded.
14
This was the case for 2,879 plans. The remaining 26,478 plans whose
14
See our report, Strengths and Limitations of Form 5500 Filings for Determining the
Funding Mechanism of Employer-Provided Group Health Plans at
https://www.dol.gov/sites/default/files/ebsa/researchers/analysis/health-and-
welfare/strengths-and-limitations-of-form-5500-filings-for-determining-the-funding-
mechanism-of-employer-provided-group-health-plans.pdf for a discussion of the
sensitivity of plans’ funding categorizations to the 50% threshold.

12
health insurance covered at least one-half of plan participants were classified as fully
insured. In total, 23,704 plans (42%) were identified as self-insured, 4,098 plans
(7%) as mixed-funded, and 28,409 plans (51%) as fully insured.
While this approach is subject to some data quality issues (further discussed below),
we believe it results in a meaningful characterization of health plans’ funding
mechanism.
Issues in Defining Funding Mechanism
The information on Form 5500 may be incomplete or inconsistent. Some of the
issues affecting the funding mechanism definition are as follows:
According to subject matter specialists, an employer may set up a subsidiary
that acts as an in-house insurance company and sells health insurance to
employees. These “captive” insurance companies are subject to state
regulations regarding insurance companies. Plan sponsors purchasing
insurance from a captive insurance company would file a Schedule A, which
does not require disclosing that the insurance company is captive. In the
classification, such plans would thus be considered fully insured, even though
the employer group to which they belong is incurring a risk substantially
similar to that of a self-insured plan. Since nothing on the Form 5500 permits
the identification of captive insurance companies, we were not able to
quantify how frequently this issue arises.
As explained above, 7% of Form 5500 filing health plans contained both
externally insured and self-insured health components in 2016. While the
distinction may be clear conceptually, Form 5500 data limitations imply that
the health plan as a whole must be categorized as mixed-funded (partially
self-insured and partially insured). The issue arises in part because Form
5500s are required for each plan, not for each type of benefit offered under a
plan. Where a plan provides multiple types of welfare benefits or multiple
types of health benefit options, it is not always possible to attribute responses
to the health benefit component(s) of the filer’s welfare plan. Also, a plan
may indicate funding benefits through insurance contracts and from general
assets without specifying which plan components are funded in either way.
Separately, Form 5500 data limitations arise from the fact that the Form 5500
does not ask details about self-insured plan components. At the
participant/policy level, however, a benefit is either self-insured or fully
insured.
As noted, plans may attach both one or more Schedules A (evidence of
insurance) and a Schedule H or I (evidence of a trust suggesting self-
insurance). If trust payments were within 10% of insurance payments, we
conclude that the trust passes through insurance payments and classify the
plan as fully insured. However, if the trust and insurance payments differ by
more than 10%, the plan is classified as mixed-funded. The 10% criterion
may not always accurately distinguish funding types, especially if insurance
contracts and trusts have different fiscal years.
Also, as noted above, plans may offer self-insured health benefits to some
participants and fully insured benefits to others, but the Form 5500 provides
little insight about the number of participants in the self-insured component.
Reflecting such scenarios, plans may also be classified as mixed-funded if
fewer than 50% of plan participants are covered by health insurance

13
contracts. The comparison is less than perfect. First, the number of “persons
covered” by insurance contracts, as reported on Schedule A, may be
interpreted as inclusive of dependents, whereas the definition of “participant”
for Form 5500 explicitly excludes dependents (see 2016 Instructions for Form
5500). Second, on plans that provide multiple types of benefits, not all
reported participants may in fact be participants in the health benefits
component of the plan.
The classification may not recognize mixed funding due to carve-out services.
For example, a plan may purchase insurance coverage for mental health
benefits and self-insure other health benefits. Its Form 5500 filing would
include a Schedule A with details of the mental health carve-out but might list
the benefits provided under the contract as “group health” because there isn’t
a separate category for “mental health” benefits on Schedule A, as there is for
“dental,” “vision,” and “prescription drugs.”
Some plans may have filed a Schedule A for an ASO contract even though
such a contract is not an insurance contract and the instructions advise filers
not to file a Schedule A for an ASO contract. We attempted to identify such
Schedules A through potentially reported TPA payments, stop-loss coverage,
or implausibly low per-person premium amounts, but the process may not be
perfect.
Among plans that reported a funding or benefit arrangement through
insurance, approximately 0.7% did not file a Schedule A with insurance
contract details. In such cases, it was assumed that the plan was fully
insured.
Among plans that reported a funding or benefit arrangement through
insurance, approximately 1.6% filed one or more Schedules A without the
type of benefit that the insurance contract covered. In such cases, unless
they had also filed another Schedule A for health insurance, it was assumed
that the insurance contract provided health benefits.
For more details on data anomalies that stood in the way of unambiguous funding
mechanism classifications, see our report on Strengths and Limitations of Form 5500
Filings for Determining the Funding Mechanism of Employer-Provided Group Health
Plans.
15
Stop-Loss Insurance
While self-insured plans bear the financial risks of health benefits and claims, some
self-insured plans purchase insurance against particularly large losses. As discussed
in the Analysis section below, roughly one in four self-insured plans report such
catastrophic or stop-loss insurance on their Form 5500 health plan filings.
16
While
stop-loss coverage mitigates financial risks, the plan is still considered self-insured or
mixed-funded.
15
Available at https://www.dol.gov/sites/default/files/ebsa/researchers/analysis/
health-and-welfare/strengths-and-limitations-of-form-5500-filings-for-determining-
the-funding-mechanism-of-employer-provided-group-health-plans.pdf.
16
As also explained in the Analysis section, if the beneficiary of stop-loss insurance is
the employer/sponsor rather than the plan and it was not purchased with plan
assets, it need not be reported on Form 5500. The true prevalence of stop-loss
insurance, therefore, cannot be gleaned from Form 5500 health plan filings alone.
14
4. ANALYSIS
This section documents the findings of our analyses. We first present the Form 5500
distribution of funding mechanism by plan and plan sponsor characteristics. We then
turn to health plan sponsors for which external financial information was available
and present summary statistics for these sponsors by plan funding mechanism. Next,
we follow plan filings over time and document the rate at which plans have switched
funding mechanisms.
Funding Mechanisms for Plans and Participants
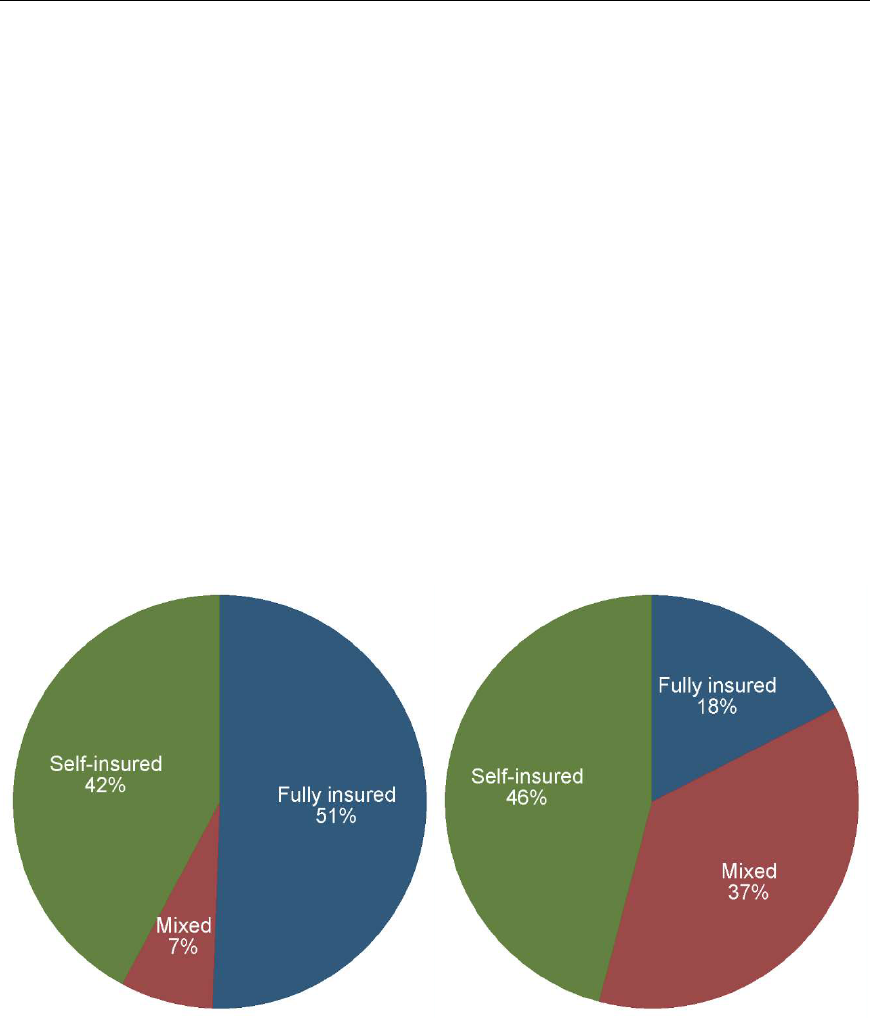
For statistical year 2016, Figure 3 shows the overall distribution of funding
mechanism among the 56,211 health plans that filed a Form 5500. About 51% of
plans were fully insured, 42% were self-insured, and 7% were mixed-funded. As
shown further below, smaller plans tend to be fully insured and many very large
plans are mixed-funded, so the funding distribution across participants is quite
different than it is across plans. About 18% of the 75 million participants were in
fully insured plans, 46% were in self-insured plans, and 37% were in mixed-funded
plans. (Percentages do not sum to 100% due to rounding.)
Figure 3. Distribution of Funding Mechanism (2016)
Plans Participants
*
*
Percentages do not sum to 100% due to rounding.
To put our analysis in context, consider recent trends in self-insurance according to
two external sources. First, the Kaiser Family Foundation and Health Research &
Educational Trust annually gather detailed information on employer-provided health
benefits, including their funding status, in Employer Health Benefits 2017 Annual

15
Survey (“KFF/HRET Survey”).
17
It found that 61% of covered workers in firms with
three or more employees were in partially or completely self-funded plans in 2016.
18
Our findings are not directly comparable, because our analysis covers only a small
subset of plans with fewer than 100 participants and because as many as 37% of
plan participants are in mixed-funded plans. Given the limitations of Form 5500
health plan filings, our results are broadly consistent with those found in the
KFF/HRET Survey.
Second, similar to the KFF/HRET Survey, the Insurance Component of the Medical
Expenditure Panel Survey (MEPS-IC) annually surveys employers about the health
benefit plans they offer.
19
Again, the findings are not strictly comparable, in part
because the unit of observation is an establishment in the MEPS-IC and a plan in the
Form 5500 data, and because size is measured in covered employees in the MEPS-IC
and plan participants in the Form 5500. That said, the results are similar. According
to the MEPS-IC, 34% of establishments with 100-999 employees self-insured at least
one plan in 2016, whereas we found that 40% of plans with 100-999 participants
were self-insured or mixed-funded (calculated from the numbers underlying Table 5
below). Weighted by employees (MEPS-IC) or participants (Form 5500), the fractions
are 37% and 48%, respectively. For larger establishments (or plans) with 1,000 or
more employees (or participants), 82% self-insured at least one plan according to
the MEPS-IC and 83% were self-insured or mixed-funded according to Form 5500
filings. Weighted by employees (MEPS-IC) or participants (Form 5500), the fractions
are 83% and 90%, respectively.
Funding Mechanisms by Plan Size
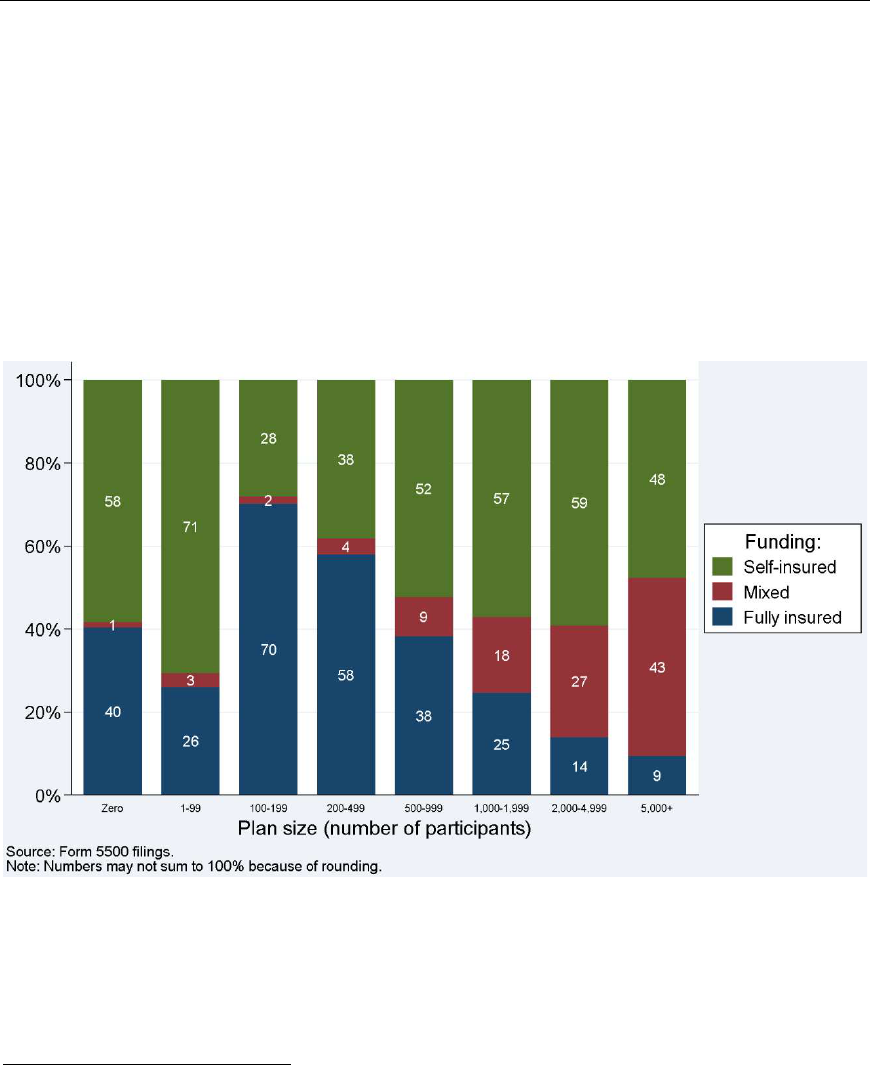
Figure 4 shows the distribution of funding mechanism by plan size for health plans in
2016. Most small plans are identified as self-insured in our study, but this is
presumably due to the select nature of small plans in our analysis. Plans with fewer
than 100 participants generally are required to file a Form 5500 only if they use a
trust or separately maintained fund to hold plan assets or act as a conduit for the
17
Employer Health Benefits, 2017 Annual Survey. Kaiser Family Foundation and
Health Research & Educational Trust. Available at
http://kff.org/health-costs/report/2017-employer-health-benefits-survey.
18
The KFF/HRET survey defines covered workers as “employees receiving coverage
from their employer.”
19
Medical Expenditure Panel Survey Insurance Component Chartbook 2016.
Rockville, MD: Agency for Healthcare Research and Quality, September 2017. AHRQ
Publication No. 17-0034-EF. Available at
https://meps.ahrq.gov/data_files/publications/cb21/cb21.pdf.
16
transfer of plan assets, which is often associated with self-insurance.
20,21
Plans with
fewer than 100 participants that are fully insured or pay benefits from the general
assets of the employer and that are not MEWAs required to file the Form M-1 are not
required to file a Form 5500 and, therefore, are not included in this analysis.
22
Apart
from plans with fewer than 100 participants, the likelihood that a plan is self-insured
generally increases with plan size. The pattern is particularly pronounced for mixed-
funded plans, presumably because larger plans may offer multiple plan options,
some of which are fully insured and some of which are self-insured. The share of
plans with 5,000 or more participants that are self-insured or mixed-funded is 91%,
compared with 30% among plans with 100-199 participants.
Figure 4. Distribution of Funding Mechanism, by Plan Size (2016)
20
Self-insured plans with fewer than 100 participants, without trust assets, and that
are not MEWAs required to file the Form M-1 are generally not required to file a Form
5500 and are therefore not in the analysis. These may include so-called level-funded
plans.
21
The analysis inclusion is based on participants at the beginning of the plan year,
whereas Figure 4 distinguishes plans based on their number of participants at the
end of the year. Some plans with fewer than 100 participants at the beginning of the
year may therefore be included in categories with 100 or more participants at the
end of the year, and vice versa.
22
This applies to the vast majority of small health plans; see footnote 2 on page 2.

17
Table 5 shows the numbers underlying Figure 4. It also shows the participant-
weighted distribution of funding mechanism by plan size, which is similar to the plan-
weighted distribution.
Table 5. Distribution of Funding Mechanism, by Plan Size (2015)
Participants Plans Participants
in plan Fully insured Mixed Self-insured Fully insured Mixed Self-insured
Zero 40.3% 1.3% 58.4%
1-99 26.0% 3.3% 70.7% 42.4% 3.5% 54.1%
100-199 70.1% 1.7% 28.1% 69.8% 1.8% 28.4%
200-499 58.0% 3.8% 38.2% 56.5% 4.1% 39.4%
500-999 38.3% 9.5% 52.3% 37.4% 9.9% 52.7%
1,000-1,999 24.6% 18.3% 57.1% 24.2% 19.0% 56.8%
2,000-4,999 13.9% 26.9% 59.1% 13.4% 27.8% 58.8%
5,000+ 9.4% 42.9% 47.7% 8.5% 48.1% 43.4%
All 50.5% 7.3% 42.2% 17.5% 36.6% 45.9%
Sourc e: Form 5500 health plan filings.
The finding that larger plans are more likely to adopt mixed-funding or self-insurance
is consistent with the 2016 KFF/HRET Survey. That study found that 13% of covered
workers at firms with 3-199 employees were covered by self-insured plans in 2016,
compared with 94% of covered workers at firms with 5,000 or more employees.
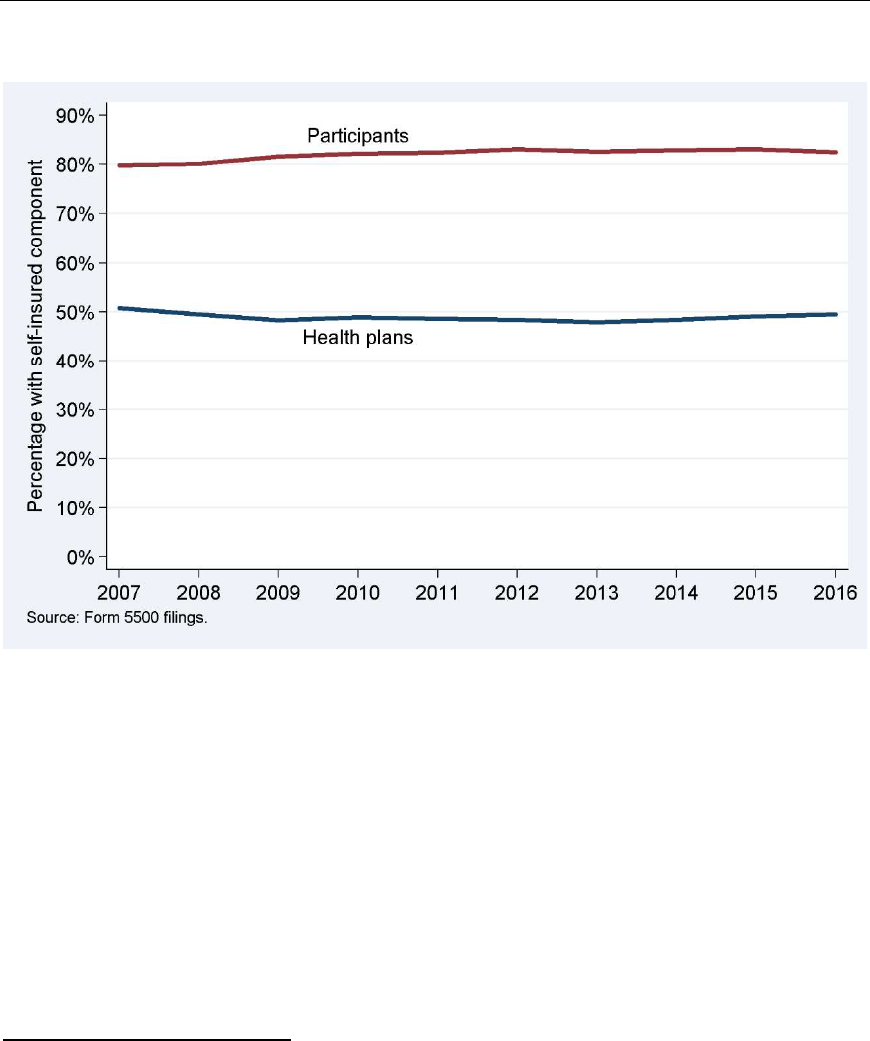
Funding Mechanisms by Year
Figure 5 shows the funding mechanism distribution for health plans by statistical
year for 2007-2016. The percentage of plans that were self-insured or mixed-funded
generally declined from 51% in 2007 to 48% in 2009, was approximately flat
through 2013, and then slightly increased to 49% in 2016. While the general trend
among plans over the first few years of the past decade was away from self-
insurance, the share of participants in health plans that self-insured or were mixed-
funded increased by about 3 percentage points from 80% in 2007 to 83% in 2012
and remained approximately flat thereafter. In comparison, the KFF/HRET Survey
documented a continuing increase toward self-insurance, up 5 percentage points
between 2007 and 2012, and another 3 percentage points by 2015. However,
KFF/HRET reported that the self-insured or mixed-funded rate subsequently dropped
by 3 percentage points between 2015 and 2017. Thus, the overall trend toward self-
insurance among participants appears to have flattened out based on findings from
both this study and the KFF/HRET study.
23
23
The participant-weighted share of plans with a self-insured component slightly
decreased from 83.1% in 2015 to 82.5% in 2016 (see Figure 5 and Table 6). This
decrease appears to be related to three large plans that were new to the analysis in
2016 and were fully insured. While they indicated providing health benefits, their
primary purpose appears to be travel insurance benefits. The number of participants
in these three plans was approximately 734,000 (1.0% of participants in all plans
combined).
18
Figure 5. Distribution of Funding Mechanism, by Statistical Year
Table 6 provides additional details on the percentages underlying Figure 5, with
separate series for the mixed-funded and self-insured categories.
24
Table 7 further
shows the corresponding plan and participant counts. The total number of health
plans in each year was between approximately 45,000 and 56,000 and the number
of participants was between approximately 67 million and 75 million.
24
As also noted in past reports, Figure 5 and Table 6 pose a paradox: the share of
plans that were mixed-funded or self-insured generally decreased in the early part of
the past decade, but the share of participants in such plans generally increased. The
paradox may be explained as follows. First, self-insurance has become less prevalent
among relatively small plans (100-499 participants) and more prevalent among
relatively large plans (500 or more participants). Second, the fraction of plans with
fewer than 100 participants in the data decreased. The analysis includes such plans
only if they operated a trust, which tends to be associated with self-insurance. The
combined result is that fewer plans are mixed-funded or self-insured, but those plans
cover increasingly more participants. For further discussion see the 2018 version of
this report.

19
Table 6. Distribution of Funding Mechanism, by Statistical Year
Statistical Plans Participants
year Fully insured Mixed Self-insured Fully insured Mixed Self-insured
2007 49.3% 7.5% 43.3% 20.2% 34.9% 44.9%
2008 50.5% 7.6% 41.9% 19.9% 35.5% 44.6%
2009 51.7% 7.6% 40.7% 18.4% 37.7% 43.9%
2010 51.1% 7.4% 41.6% 17.9% 37.5% 44.6%
2011 51.4% 7.5% 41.1% 17.6% 37.1% 45.3%
2012 51.6% 7.3% 41.0% 17.0% 36.8% 46.2%
2013 52.1% 7.5% 40.4% 17.4% 37.3% 45.2%
2014 51.6% 7.3% 41.0% 17.1% 36.5% 46.4%
2015 50.9% 7.2% 42.0% 16.9% 36.2% 46.8%
2016 50.5% 7.3% 42.2% 17.5% 36.6% 45.9%
Source: Form 5
500 health plan filings.
Note: Participant percentages may not be consistent with participant numbers in
Table 7 because they are calculated based on non-rounded numbers.
Table 7. Plans and Participants by Funding Mechanism, by Statistical Year
Statistical
Plans Participants (millions)
year Fully insured Mixed Self-insured Fully insured Mixed Self-insured
2007
23,124
3,509
20,303
13.8
23.7
30.6
2008 22,815 3,448 18,921 13.5 24.1 30.3
2009 24,333 3,602 19,169 12.3 25.1 29.2
2010 25,210 3,628 20,503 12.2 25.5 30.4
2011 25,098 3,669 20,088 12.0 25.4 31.0
2012 25,510 3,614 20,275 11.7 25.4 32.0
2013 26,183 3,774 20,270 12.1 26.0 31.5
2014 26,657 3,795 21,191 12.1 25.8 32.8
2015 27,723 3,905 22,860 12.3 26.3 34.0
2016 28,409 4,098 23,704 13.2 27.5 34.5
Source: Form 5500 health plan filings.
Funding Mechanisms by Industry
Figure 6 shows the funding mechanism distribution by industry, as identified by the
business code provided on Form 5500 filings. We present the percentage breakdown
of plans by the funding mechanism for a classification of major industry groups.
Plans in the utilities, mining, agriculture, and construction industries are the most
likely to be mixed-funded or self-insured, whereas the services and retail trade
industries are the most likely to be fully insured. Some of the relationship between
funding mechanism and industry may be due to variation across industries in health
plan sizes.
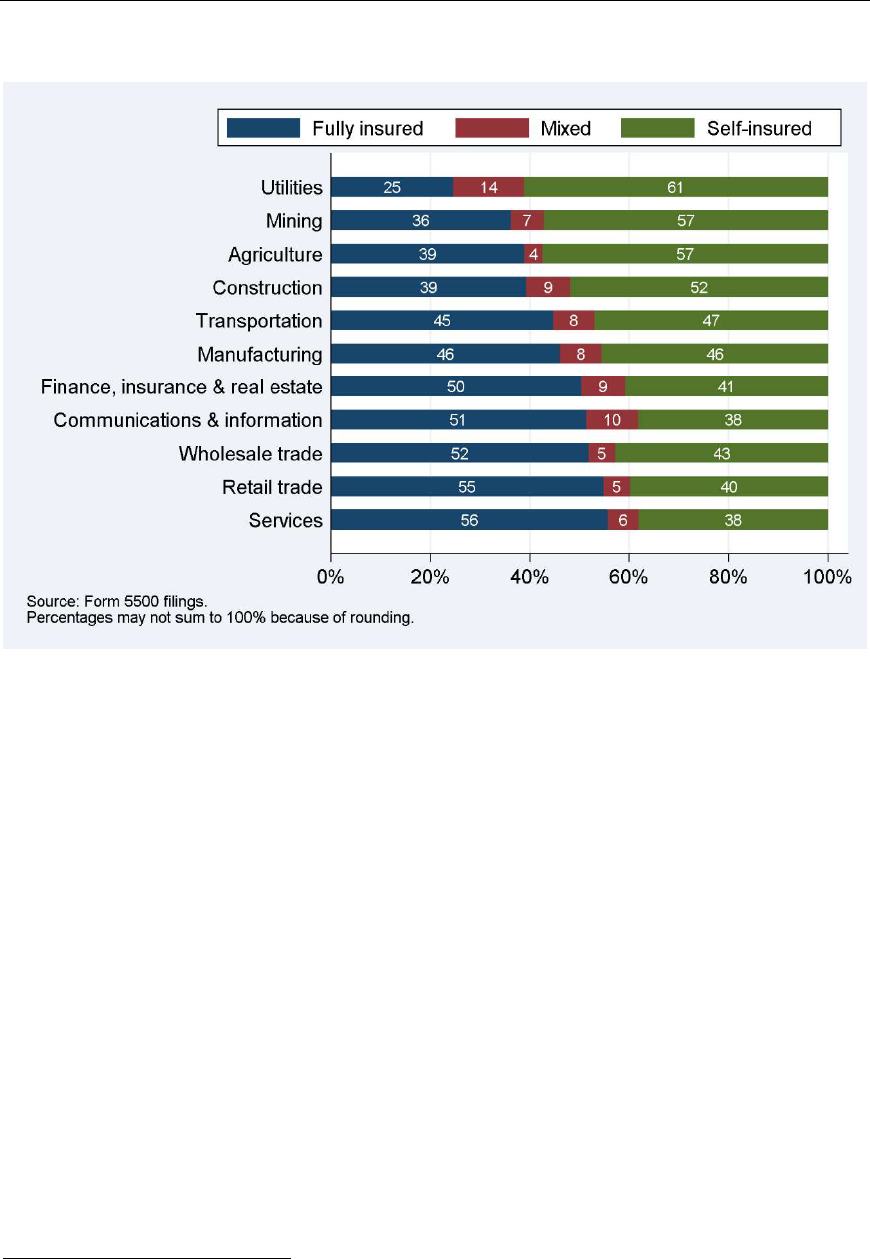
20
Figure 6. Distribution of Funding Mechanism, by Industry (2016)
Some industry patterns do not appear consistent with those documented by the
2016 KFF/HRET Survey. That study found that the agriculture/mining/construction
industry had below-average and retail above-average self-funding rates. Part of the
difference may be due to small plans, which were included in the KFF/HRET Survey
but mostly excluded from our analysis. Part may also be due to the fact that
KFF/HRET figures are for participants, whereas Figure 6 relates to plans. Weighted
by participants, we also find an above-average self-funding rate for plans in the retail
sector.
Funding Mechanisms over the Life Cycle of Plans
We noted earlier that plans tended to move toward full insurance over the first few
years of the past decade, whereas the fraction of participants in fully insured plans
was generally declining (Figure 5). Underlying this paradox is a divergence of smaller
and larger plans: smaller plans have tended to move toward full insurance whereas
larger plans have tended to move toward self-insurance (Footnote 24). In an attempt
to gain a fuller understanding of these trends, we now turn to funding mechanisms
over the life cycle of plans.
25
We distinguish among plans at the beginning of their life, at the end of their life, and
during the years in between. For example, it is unclear whether the observed shifts
were due to the funding mix of new plans, the funding mix of terminating plans, net
switches among established plans, or a combination of factors. The analysis is
25
For the lifecycle perspective in this section, we follow filings of individual plans
over time. In order to minimize gaps, the analysis includes voluntary filings.

21
somewhat hampered by the fact that Form 5500 filings contain incomplete
information about the beginning and end of plans’ lives:
New: We identify the beginning of a plan’s life cycle based on the Form
5500’s “first return/report” check box.
26
Cease filing: We attempt to capture the end of a plan’s life cycle in two ways.
First, a plan may have indicated on its Form 5500 that it is terminating,
namely by checking the “final return/report” box, by reporting a resolution to
terminate the plan, or by documenting that all assets were transferred out of
the plan.
27
Second, a plan may stop filing a Form 5500 without prior
indication. Doing so does not necessarily imply that the plan terminated; it
may be non-compliant or it may have shrunk and become exempt (and
neglected to note this by writing “4R” on Line 8b of the Form 5500). To
mitigate this issue, we ignore gaps in filings. Recognizing that some plans in
this category have in fact not reached the end of their life cycle, we label
them as plans that “ceased filing.”
28
Established: This category captures the middle of a plan’s life cycle. Plans that
were neither “new” nor “ceased filing” are labeled “established” plans.
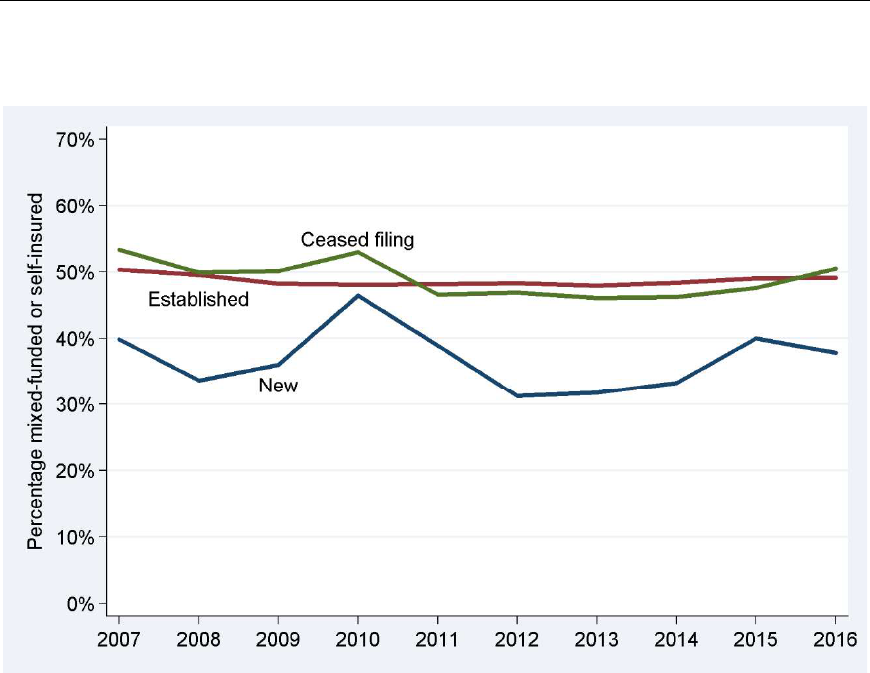
We will discuss plan-level and participant-level trends separately. Starting with plan-
level developments, Figure 7 shows the mixed-funded or self-insured share of new
plans, established plans, and plans that ceased filing. (Since most plans are
established, the overall share is very close to the share among established plans.)
New plans were more often fully insured than other plans, but the self-insurance gap
between new plans and other plans was narrower in 2015 and 2016 than in most
previous years, which helps explain the slight reduction in full insurance in recent
years (Table 6).
29
26
Some plans never checked that box, or not until later in their life cycle. If the box
was not checked until the, say, fourth filing, we exclude the earlier filings from the
analysis. If the box was checked multiple times, we identify the plan as “new” only
the first time.
27
Some plans repeatedly indicated terminating but continued submitting filings. We
ignore indications of terminating if the plan continued filing in subsequent years.
Separately, plans that reported termination on their initial filing were included in
both the “new” and “ceased filing” categories. Also see Figure 10 below.
28
In terms of timing, if a plan indicated on its 2013 filing that it was terminating, we
consider it as having ceased filing in 2013. If a plan submitted filings through 2013
but not in any later year, we consider it as having ceased filing in 2014.
29
The number of new plans in 2016 was 4,573: 2,844 fully insured plans (62%), 138
mixed-funded plans (3%), and 1,591 self-insured plans (35%). New plans covered
approximately 2,127,000 participants: approximately 803,000 in fully insured plans
(38%), 561,000 in mixed-funded plans (26%), and 763,000 in self-insured plans
(36%).
22
Figure 7. Percentage Mixed-Funded or Self-Insured among New Plans,
Established Plans, and Plans That Ceased Filing, by Statistical Year
Changes in Mixed/Self-Insurance Due to Plans Switching Funding Mechanism
This section discusses funding mechanism switch rates among new and established
plans and the resulting flows of plans toward or away from self-insurance.
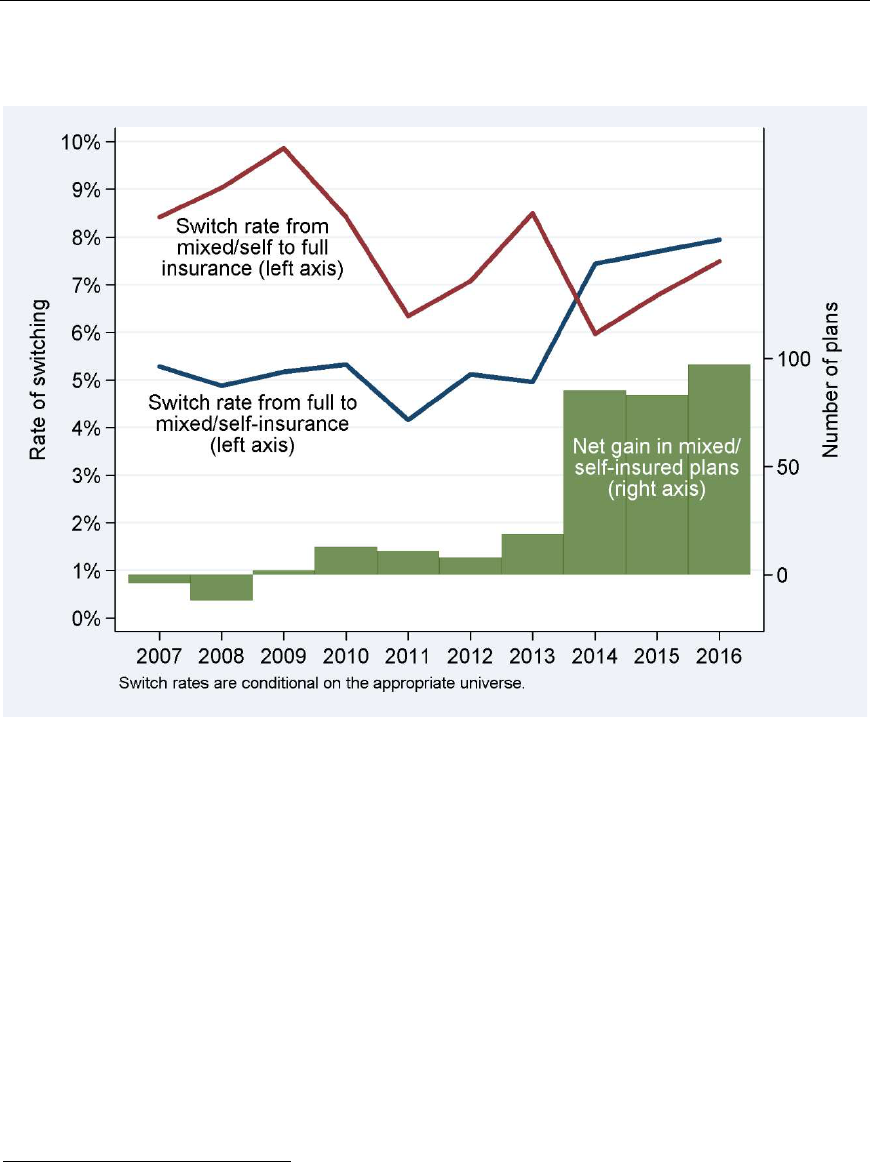
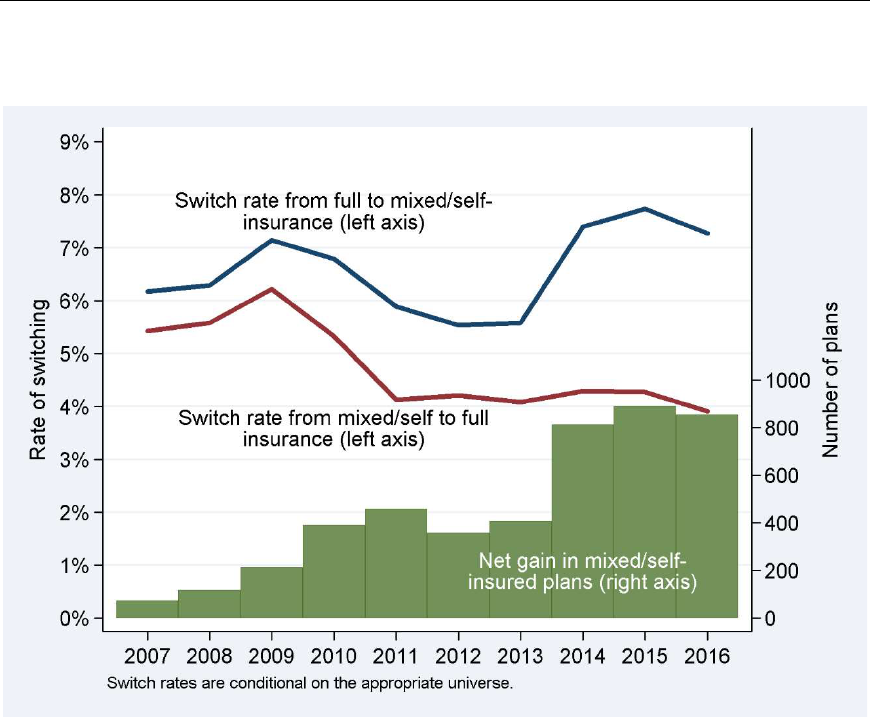
Figure 8 shows the switch rate for new plans over time, i.e., funding mechanism
changes between plans’ first and second filings. Through 2013, mixed-funded or self-
insured plans were more likely to switch to full insurance (red line) than fully insured
plans were to switch to a form of self-insurance (blue line). For example, 8.5% of
plans that started in 2012 as mixed-funded or self-insured had switched to full
insurance by 2013, compared with 5.0% of fully insured plans that had switched to
mixed funding or self-insurance. This does not mean that the net flow of plans was
toward full insurance: Figure 7 above showed that about 31% of new plans in 2012
were self-insured or mixed-funded, so the number of plans switching toward self-
insurance (5.0% of 69%) is slightly higher than plans moving toward full insurance
(8.5% of 31%). Indeed, the net flows were very small from 2005 through 2013, with
fewer than 10 plans annually, on net, moving in one direction or the other (green
bars).
23
Figure 8. Rates of Funding Switching among New Plans and the Resulting
Net Gain in Plans with a Self-Insured Component, by Statistical Year
Switch rates reversed in recent years. In 2014-2016, new plans were more likely to
switch toward self-insurance than away from it. On net, 85-97 new plans annually
switched toward self-insurance in 2014-2016 (green bars). Both recently increasing
self-insurance rates among new plans (Figure 7) and recently increasing switch rates
to self-insurance in plans’ second year of life (Figure 8) help explain the recent uptick
in overall self-insurance rates.
Similarly, Figure 9 shows the switch rate for established plans over time and the
resulting net flow of plans toward self-insurance. Switch rates are higher toward self-
insurance (blue line) than away from it (red line), especially since 2014. For
example, 3.9% of established plans that in 2015 were mixed-funded or self-insured
had switched to full insurance by 2016, compared with 7.3% of fully insured plans
that had switched to mixed funding or self-insurance.
30
30
Some plans appear to switch funding mechanisms more often than is plausible. In
some cases, the issue is that two plans—one insured, one self-insured—are reported
with the same EIN and PN. In other cases, incomplete or ambiguous information on
Form 5500 filings may result in conflicting categorizations from one year to the next.
The switching rates in Figure 9 may thus overstate true switching rates, but the net
effect on plan flows should be approximately zero.
24
Figure 9. Rates of Funding Switching among Established Plans and the
Resulting Net Gain in Plans with a Self-Insured Component, by Statistical Year
Again, the switch rate patterns in Figure 9 do not necessarily reflect flows of plans
because of (small) differences in the numbers of established plans that were fully
insured or mixed-funded/self-insured. The green bars indicate the net gains in plans
with a self-insured component as a result of switching by established plans. On net,
switching by established plans added to the number of plans with a self-insured
component, especially starting in 2014. The flows were larger among established
plans than among new plans, with approximately 800 plans annually moving toward
self-insurance in 2014-2016.
Figure 5 showed that until about 2010, an increasing share of health plans were fully
insured; switch patterns among new plans contributed very little to that trend, and
the green bars in Figure 9 demonstrate that switch patterns among established plans
went counter to the overall trend. In 2014-2016, consistent with switch patterns
among new and established plans, the prevalence of mixed-funding or self-insurance
increased slightly.
Changes in Mixed/Self-Insurance Due to Plans Ceasing Filing
Figure 10 shows the rates at which new plans ceased filing; they could have checked
both the first and final return/report checkboxes, or they could have filed just a
single Form 5500. In all years from 2007 to 2016, mixed-funded or self-insured new
plans were more likely to cease filing (red line) than their fully insured counterparts
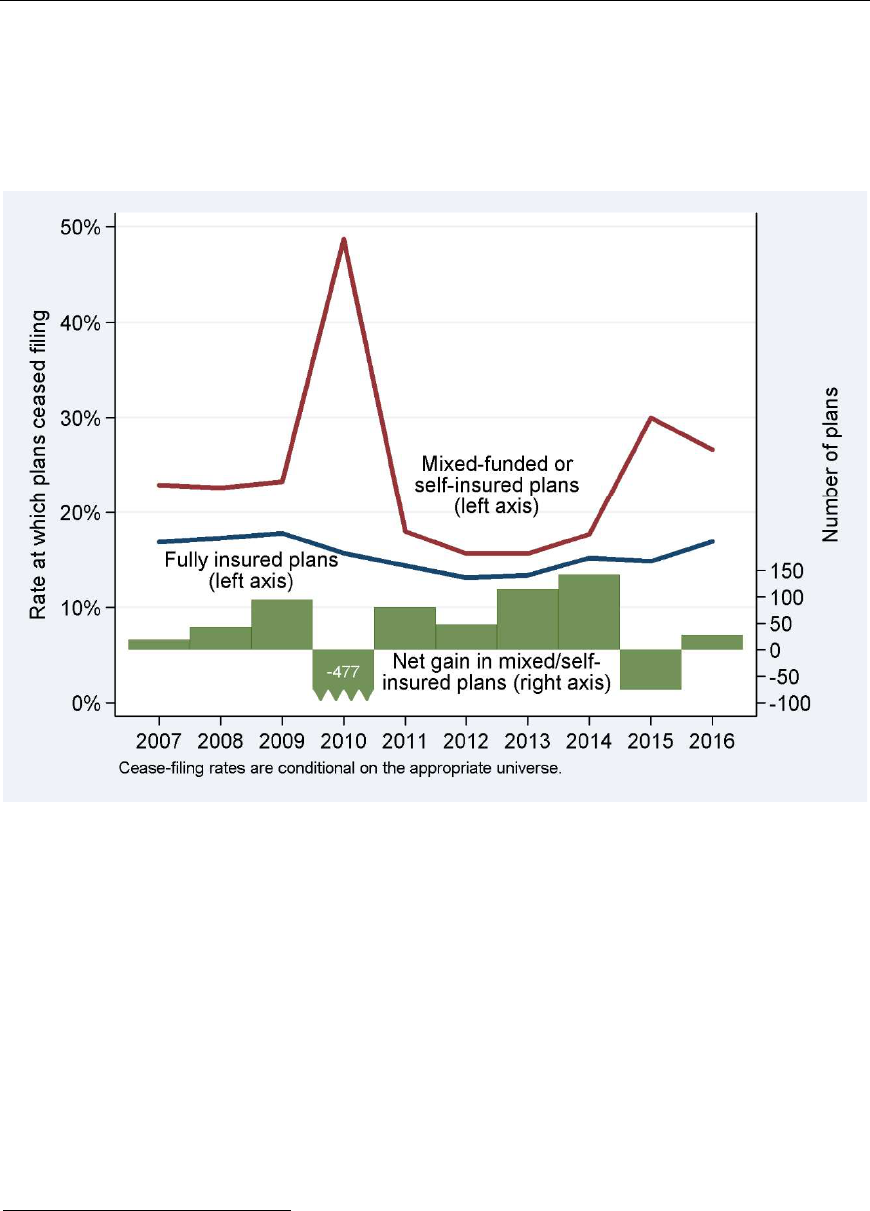
25
(blue line).
31
In terms of absolute numbers, more fully insured plans terminated,
resulting in relatively more remaining plans with a self-insured component (green
bars), except in 2010 and 2015.
Figure 10. Rates at Which New Plans Ceased Filing, by Statistical Year
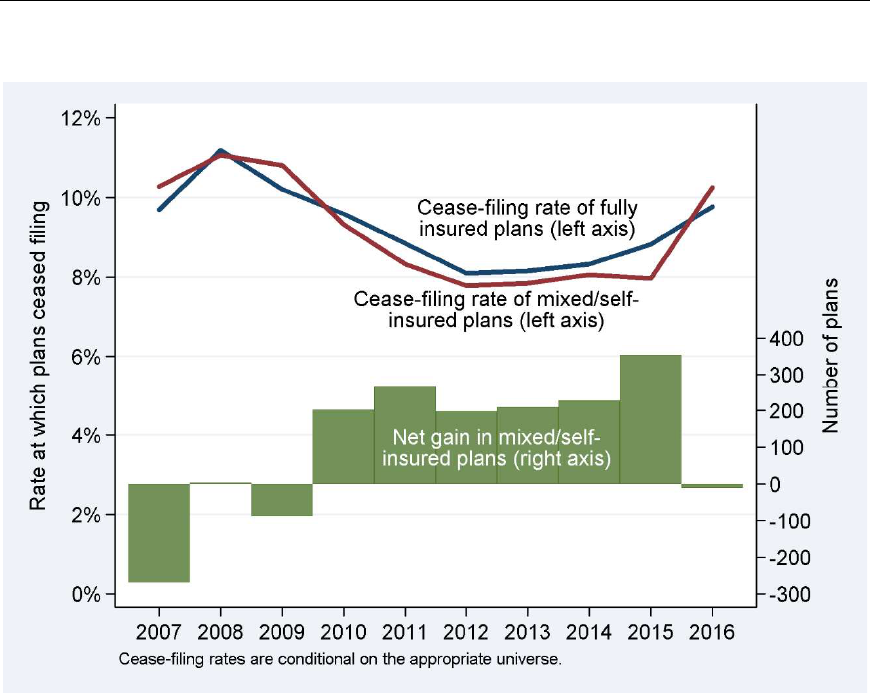
Similarly, Figure 11 shows that rates at which established fully insured plans ceased
filing (blue line) were generally close to those of mixed-funded or self-insured plans
(red line). Until 2009, the net effect was a decrease in the prevalence of mixed/self-
insured plans (green bars). In 2010-2015, fully insured plans ceased filing in larger
numbers than mixed-funded or self-insured plans, while in 2016 the flows were
approximately equal.
31
The spike in 2010 appears to be an anomaly due to a single administrator who
submitted more than 800 Form 5500 filings for small, self-insured plans in 2010 and
checked both the first and final return/report boxes. No such explanation is evident
for the increase in 2015-2016.
26
Figure 11. Rates at Which Established Plans Ceased Filing
In conclusion, the share of plans that were fully insured was increasing until 2013.
This was mostly caused by new plans and, up to 2009, was amplified by patterns in
the number of plans that ceased filing. The majority of new plans were fully insured.
The net effect of changes in funding mechanism over the life cycle went in the
opposite direction, with more plans switching toward mixed/self-insurance than
toward full insurance. Up to 2009, more mixed-funded or self-insured plans ceased
filing than fully insured plans did, but that pattern reversed starting in 2010. Indeed,
the overall trend among plans toward full insurance leveled out starting around 2010
(see Figure 5 and Table 6). Starting in 2014, the trend toward full insurance
reversed because of increased self-insurance among new plans (Figure 7), and more
net switching to self-insurance by new plans (Figure 8) and established plans (Figure
9).
The ACA was enacted in 2010 and many of its provisions became effective in 2014,
which coincides with increased self-insurance among new plans and increased net
switching toward self-insurance among all plans. While our analysis of the trends
documented above is agnostic with respect to causality, it is possible that the ACA
prompted elevated interest in self-insurance. We emphasize that the changes were
moderate; the share of plans with a self-insured component rose from 47.9% in
2013 to 49.5% in 2016 (see Figure 5 and Table 6).
Small and Large Plans Behaved Differently
The discussion above generally ignored plan size. However, while the overall fraction
of plans that are fully insured generally increased over time, the fraction of

27
participants covered by those fully insured plans has moved in the opposite direction
(Figure 5 and Table 6). Indeed, small and large plans followed different patterns, as
demonstrated in this section.
Figure 12 shows the percentage of participants who were covered by a mixed-funded
or self-insured plan, by plan life cycle stage, from 2007 to 2016. It is the participant-
weighted counterpart of Figure 7. Mirroring the pattern among plans, participants in
new plans were generally less likely to be in mixed-funded or self-insured plans than
those in established plans. However unlike in Figure 7, participants in plans that
ceased filing were also less likely to be in mixed-funded or self-insured plans than
those in established plans, pointing at funding mechanism switching as the main
cause of the general upward trend in self-insurance among participants.
Figure 12. Participant-Weighted Percentage Mixed-Funded or Self-Insured
among New Plans, Established Plans, and Plans That Ceased Filing, by
Statistical Year
Before turning to switching patterns, consider that most participants are covered by
large plans (Table 1 and Table 8).
32
We restrict the analysis to the most recent five
years (2012-2016). Only about 1% of new plans covered 5,000 or more participants,
but those plans accounted for 45% of participants in all new plans. Among
established plans, 65% of participants were in plans with 5,000 or more participants.
32
Table 8 shows that 1.1% of new plans in 2012-2016 had 5,000 or more
participants. A manual review indicated that such plans commonly were successor
plans to prior plans that were replaced or consolidated, such as after a corporate
merger. Likewise, many plans that ceased filing may have been replaced with other
plans and secured continuing health benefit coverage for their participants.

28
The behavior of plans with more than 5,000 participants is therefore key to
understanding participant-weighted trends in funding.
Table 8. Distribution of Health Plans and Plan Participants, by Plan
Participant Counts (2012-2016)
Participants New Plans Established Plans
Plans That Ceased Filing
in plan (EOY) Plans Participants Plans Participants Plans Participants
Zero 3.1% 0.0% 0.4% 0.0% 33.7% 0.0%
1-99 14.7% 1.3% 8.2% 0.3% 19.9% 2.6%
100-199 51.9% 14.9% 31.0% 3.2% 20.9% 6.9%
200-499 19.6% 12.3% 31.5% 6.9% 14.8% 10.6%
500-999 5.1% 7.5% 12.3% 6.1% 5.1% 8.1%
1,000-1,999 2.6% 7.8% 7.3% 7.2% 2.8% 9.0%
2,000-4,999 1.8% 11.7% 5.2% 11.5% 1.7% 12.5%
5,000+ 1.1% 44.5% 4.1% 64.7% 1.0% 50.5%
Total 100.0% 100.0% 100.0% 100.0% 100.0% 100.0%
Source: Form 5500 health plan filings.
Note: Percentages may not sum to 100% because of rounding.
Table 9 shows the annual rate of funding mechanism switching among new and
established plans. Overall, 6.9% of plans that started as fully insured switched to
mixed-funded or self-insured during their second reporting period, but large plans
were much more likely to make that switch than small plans. For example, 27% of
fully insured new plans with 5,000 or more participants changed funding mechanism,
compared with less than 8% of plans with 1-500 participants. Conversely, small
plans that started life as mixed-funded or self-insured were more likely to switch to
fully insured than their larger counterparts. A similar pattern existed among
established plans. Since most participants are in large plans, the implication is that,
on net, participants in both new and established plans migrated to mixed-funded or
self-insured plans.
Table 9. Annual Rates of Funding Switching among New and Established
Plans, by Plan Size (2012-2016)
New Plans Established Plans
Swit
ch to Switch to
EOY plan
mixed or self-
Switch to
mixed or self-
Switch to
participants insured fully insured insured fully insured
Zero 10.3% 4.7% 12.0% 8.4%
1-99 6.9% 3.2% 5.9% 3.0%
100-199 5.3% 10.8% 4.6% 7.1%
200-499 7.6% 10.0% 6.3% 4.9%
500-999 11.7% 6.2% 10.0% 3.3%
1,000-1,999 13.8% 6.5% 12.9% 2.3%
2,000-4,999 22.6% 2.6% 17.6% 1.6%
5,000+ 26.7% 4.0% 18.0% 1.5%
All 6.9% 7.1% 6.7% 4.2%
Source: Form 5500 health plan filings.
Not
e: Rates are conditional on the appropriate universe. For example,
the denominator for the first column is fully insured new plans.

29
Rates at which plans ceased filing also varied by plan size (Table 10), with small
plans much more likely to stop filing in 2012-2016 than large plans.
33
Among plans
with 5,000 or more participants, fully insured plans ceased filing at a higher rate
than mixed-funded or self-insured plans.
Table 10. Annual Rates at Which New and Established Plans Ceased Filing,
by Plan Size (2012-2016)
New Plans Established Plans
BOY plan Mixed or Mixed or
participants self-insured
Ful
ly insured
self-insured Ful
ly insured
Zero 84.1% 80.0% 43.8% 38.2%
1-99 37.2% 29.8% 16.3% 18.8%
100-199 18.6% 15.0% 10.6% 9.6%
200-499 13.3% 10.2% 6.9% 6.9%
500-999 15.1% 10.7% 6.7% 6.3%
1,000-1,999 10.4% 11.5% 5.8% 6.5%
2,000-4,999 4.9% 6.1% 5.1% 6.0%
5,000+ 3.9% 13.9% 3.8% 6.0%
All 22.6% 15.0% 8.4% 8.6%
Source: Form 5500 health plan filings.
In conclusion, large plans on net switched away from full insurance, thereby
increasing the fraction of participants in mixed-funded or self-insured plans. Further
reinforcing this trend, large fully insured plans were more likely to cease filing than
large mixed-funded or self-insured plans. Despite these forces, mixed funding and
self-insurance retreated among participants, from 83% in 2015 to 82% in 2016
(Table 6). As discussed on page 17, this change is related to three very large travel
insurance plans that were fully insured and new to the analysis in 2016.
34
33
Given the focus on the end of the life cycle, Table 10 categorizes plans by the
number of participants at the beginning (rather than the end) of the reporting
period. On a related point, fully insured plans with zero or 1-99 participants generally
do not need to file, which may explain their high cease-filing rates. (Recall that
voluntary filings are included in the current section in order to observe as much as
possible of their life cycle; voluntary filings are excluded from the analysis in other
sections.)
34
As noted earlier, the life cycle analysis defines new plans as plans that checked the
“first return/report” box on the Form 5500. Only one of the three newly included
travel insurance plans checked that box in 2016. The other two checked it in 2015
but were excluded from the 2015 analysis because they did not indicate providing
health benefits at that time.

30
Stop-Loss Coverage of Plans
Table 11 examines the presence of stop-loss insurance. These figures must be
interpreted with caution. If stop-loss insurance identifies the health plan as the
beneficiary or it is purchased with plan assets, it must be reported on a Schedule A.
35
However, if the employer/sponsor has purchased stop-loss insurance with itself as
the beneficiary (rather than the plan), then it need not be reported on the Form
5500. The figures in Schedule A (and Table 11) thus likely understate the prevalence
of stop-loss insurance.
36
In 2016, 17% of mixed-funded and 25% of self-insured
plans reported stop-loss coverage in a Schedule A, down from 2007 rates of 24%
and 30%, respectively. The trend in reported stop-loss coverage of mixed-funded
plans was downward until 2014 and appears to have reversed since then.
Conversely, the trend among self-insured plans—downward until 2010 and fairly
stable until 2015—resumed its downward direction in 2016. Weighted by the number
of participants, approximately 15% of mixed-funded and 20% of self-insured plans
reported stop-loss coverage for 2016, indicating that smaller plans are more likely to
report stop-loss insurance than larger plans. We note that the participant-weighted
figures are historically more volatile than unweighted figures.
37,38
35
Schedule A is not required to be attached to the Form 5500-SF. Our analysis
assumes that none of the Form 5500-SF (1,508 of 23,704 self-insured plans, or 6%)
filers have stop-loss insurance.
36
Our 2012 report, Anomalies in Form 5500 Filings: Lessons from Supplemental
Data for Group Health Plan Funding, suggests that as many as four-out-of-five self-
insured or mixed-funded plans and roughly 55% of participants in such plans were
covered by stop-loss insurance, possibly purchased for the benefit of the plan
sponsor. Those stop-loss coverage levels are consistent with those in the 2013
KFF/HRET study, which found that 59% of participants in self-funded plans at firms
with 200 or more workers were in a plan that had purchased stop-loss insurance in
2013. See https://www.kff.org/private-insurance/report/2013-employer-health-
benefits. It should also be noted that reported stop-loss insurance does not
necessarily relate to health benefits but could protect other self-insured benefits,
such as disability benefits.
37
A single, very large, self-insured plan with about 1.8 million participants reported
stop-loss insurance in 2007 and 2014-2016, but not in other years. As a result, the
fraction of participants in self-insured plans with stop-loss insurance is elevated in
those years.
38
The annual KFF/HRET Survey collects information about stop-loss coverage,
including for the benefit of the plan sponsor. It documented a reduction in 2016 amid
year-on-year volatility. Weighted by workers covered by self-insured health plans,
stop-loss coverage was 59% in 2013, 65% in 2014, 60% in 2015, and 57% in 2016.

31
Table 11. Percentage of Health Plans Reporting Stop-Loss Insurance,
by Funding Mechanism and Statistical Year
Statistical Plans Participants
year
Mixed Self-insured Mixed Self-insured
2007 23.9% 30.5% 14.2% 22.4%
2008 23.0% 30.7% 12.9% 16.4%
2009 20.6% 28.2% 16.6% 16.0%
2010 19.1% 26.4% 15.2% 15.1%
2011 18.1% 26.5% 14.2% 14.7%
2012 17.5% 26.6% 13.7% 14.3%
2013 17.2% 26.0% 13.7% 14.1%
2014 16.5% 26.4% 13.8% 20.3%
2015 17.0% 26.3% 14.8% 20.0%
2016 17.3% 24.9% 14.8% 19.6%
Source: Form 5500 health plan filings.
Note: Reflects stop-loss coverage only insofar reported on Form 5500.
Table 12 shows the annual per-person cost of stop-loss coverage, calculated as the
ratio of premiums to “number of persons covered” by the stop-loss policy on
Schedule A—both the premium and the number of people covered thus refer to the
stop-loss policy only and not to the overall plan. The numbers are not adjusted for
inflation. These results should also be interpreted with caution because the Form
5500 filing contains no information on attachment points or other stop-loss policy
features that may reflect the amount of coverage provided by the policies.
39
Table 12. Per-Person Annual Premiums for Stop-Loss Insurance
Statistical Mixed-funded ($) Self-insured ($)
year 25th pct Median 75th pct 25th pct Median 75th pct
2007 97 263 505 175 522 997
2008 105 287 543 189 564 1,067
2009 138 318 577 202 580 1,105
2010 157 334 601 210 571 1,095
2011 157 335 633 230 604 1,155
2012 153 338 635 259 640 1,233
2013 171 407 756 272 684 1,314
2014 189 431 807 294 744 1,405
2015 207 447 817 346 830 1,566
2016 205 483 905 349 873 1,666
Source: Form 5500 health plan filings.
Note: Reflects stop-loss coverage only insofar reported on Form 5500.
39
Per-person premiums were calculated from Schedules A that specified stop-loss
coverage only or in combination with health benefits. Approximately 18% of such
Schedules A specified additional benefits (e.g., prescription drugs in addition to stop-
loss and health). The per-person premium may thus reflect stop-loss coverage for
benefits in addition to health benefits.
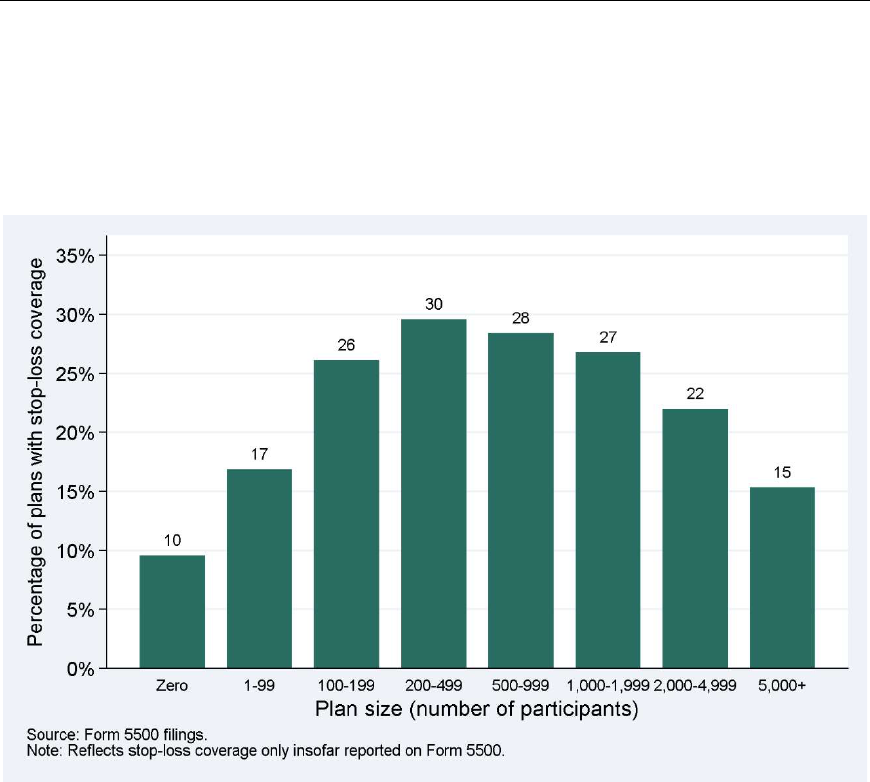
32
Figure 13 shows the rate of stop-loss coverage among self-insured plans by plan
size. Stop-loss coverage increases with plan size up to 200-499 participants and
decreases with plan size among larger plans.
Figure 13. Self-Insured Health Plans’ Rate of Stop-Loss Coverage, by Plan
Size (2016)
Lower stop-loss coverage for smaller plans is not consistent with the notion that
smaller plans face greater financial risks and should thus be more likely to purchase
stop-loss coverage. Part of the explanation may relate to the fact that stop-loss
coverage with the sponsor (rather than the plan) as beneficiary need not be reported
on Form 5500; smaller employers may be more likely to designate the firm as the
beneficiary than larger employers. The lower prevalence of stop-loss insurance
among small plans may also reflect market realities: insurance companies may not
offer stop-loss insurance to small employers, or offer it only at very high prices. The
2016 KFF/HRET Survey also documented lower stop-loss coverage rates among small
and large plans than among mid-sized plans.
Funding Mechanisms and Financial Metrics
As described above, we matched the Form 5500 health plan data to Form 990 filings
to identify whether a health plan sponsor is a for-profit or a not-for-profit entity.
Approximately 17% of plans were found to be sponsored by a not-for-profit entity.
Figure 14 presents the breakdown in funding status for for-profit and not-for-profit
firms. One-half (50%) of plans sponsored by for-profit organizations were self-
insured or mixed-funded, compared with 45% of plans sponsored by not-for-profit
organizations. Weighted by participants, not-for-profit organizations were much
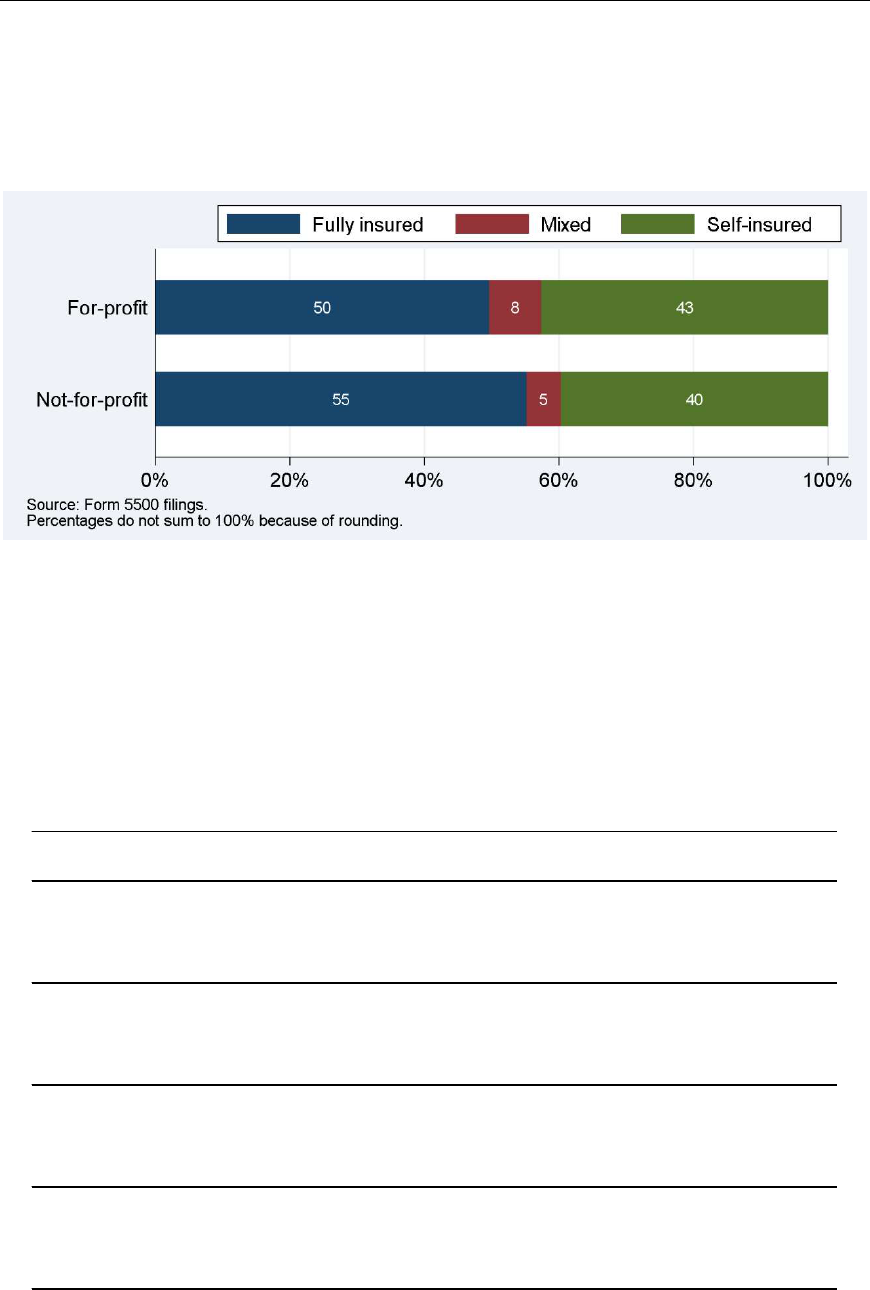
33
more likely to have self-insured plans and much less likely to have mixed-funded
plans than for-profit firms (not shown in figure).
Figure 14. Distribution of Funding Mechanism, by For-Profit and Not-for-
Profit Sponsors (2016)
Focusing on the subset of Form 5500 health plan filers that could be matched to
financial information in Capital IQ, Table 13 presents 2016 information on company
size as measured by revenue, market capitalization, net income, and number of
employees (and the number of observations (# Obs) on which each calculation is
based). The table shows that companies offering fully insured health plans tend to be
smaller than companies with self-insured or mixed-funded health plans. Companies
offering mixed-funded health plans tend to be the largest.
Table 13. Characteristics of Companies Matched to Form 5500 Health Plan
Filings, by Funding Mechanism (2016)
Fully
Self-
All insured Mixed insured
25 pct 359 108 1,373 517
Revenue
Median 1,434 323 3,702 1,539
(in $ millions)
75 pct 5,677 1,520 10,771 5,875
# Obs 3,918 1,074 964 1,880
25 pct 576 197 1,869 767
Market capitalization
Median 2,431 718 5,175 2,677
(in $ millions)
75 pct 9,294 3,225 22,381 9,749
# Obs 3,332 947 806 1,579
25 pct 1 -14 16 10
Net income
Median 72 12 178 95
(in $ millions)
75 pct 366 99 875 399
# Obs
3,8
70
1,0
59 956 1,855
25 pct 580 228 2,700 849
Number of employees
Med
ian
75 pct
3,3
00
14,200
684
3,329
9,4
00
28,332
3,6
88
14,050
# Ob
s 3,915 1,073 962 1,880
Source: Form 5500 health plan filings and Capital IQ data.
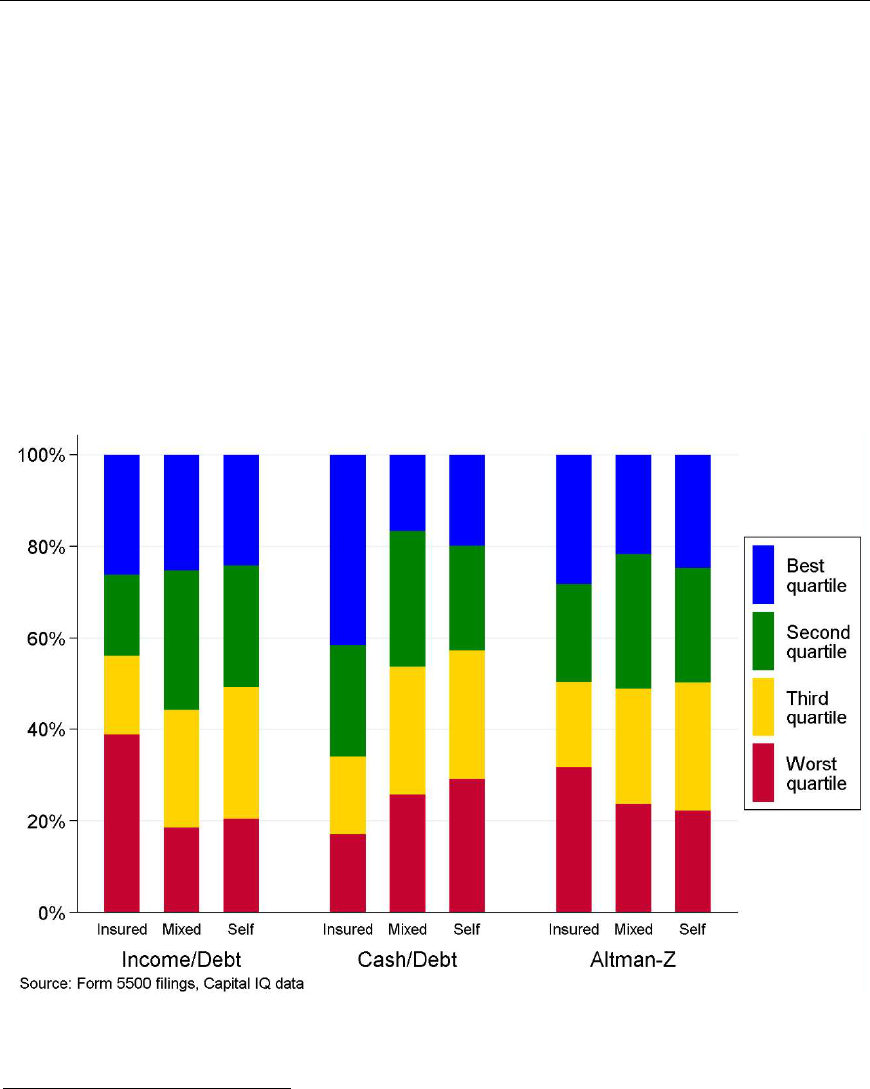
34
Figure 15 presents three metrics of the financial health of matched companies: the
ratio of operating income over total debt, the ratio of cash and cash equivalent
holdings over total debt, and the Altman Z-Score.
40
For all three, higher values
suggest better financial health. We grouped all matched plans into quartiles and
show in Figure 15 what share of fully insured, mixed-funded, or self-insured plans
fall into each quartile. Consider the ratio of operating income over total debt. If
financial health were unrelated to funding mechanisms, all bars would be equal-
sized. Instead, 39% of fully insured sponsors were in the bottom quartile, compared
with 19% of mixed-funded and 20% of self-insured sponsors; see the red bars in the
left portion of Figure 15. Based on how frequently their ratios of operating income
over total debt are in the bottom quartile, mixed-funded and self-insured companies
thus appear to be in better financial health than fully insured companies.
Figure 15. Financial Health of Companies Matched to Form 5500 Health Plan
Filings, by Funding Mechanism (2016)
The results are mixed for the other two metrics of financial strength. The Altman Z-
Score again suggests that mixed-funded and self-insured sponsors are in better
40
The Altman Z-Score is an index summarizing five financial measures that are used
to predict bankruptcy risk. A company with a Z-Score greater than 2.99 is considered
to be in a “safe” zone, one with a score between 1.80 and 2.99 in a “grey” zone and
a company with score less than 1.80 to be in a “distress” zone. The 25
th
percentile of
Altman Z-Scores of plan sponsors in our analysis was 1.56, i.e., all companies in the
bottom quartile and some in the second quartile were considered to be in the
“distress” zone. For details see Altman, E.I. (1968). “Financial Ratios, Discriminant
Analysis and the Prediction of Corporate Bankruptcy.” Journal of Finance 23(4): 589-
609.

35
financial health than fully insured sponsors, but the ratio of cash holdings to total
debt points to the opposite conclusion. In short, there is no consistent evidence that
mixed-funded or self-insured sponsors are in better or worse financial health than
fully insured sponsors. These findings are generally consistent with those in prior
reports. Finally, as in prior years, fully insured plans show a wider dispersion of
financial health (as measured by the share of plans in the bottom and top quartiles
combined) than mixed-funded or self-insured plans.
Table 14 shows the percentages and sample sizes corresponding to Figure 15.
Table 14. Financial Health of Companies Matched to Form 5500 Health Plan
Filings, by Funding Mechanism (2016)
Fully Self-
All insured Mixed insured
Best quartile 25.0% 26.2% 25.3% 24.1%
Operating income
over total debt
Sec
ond quartile
Third quartile
Worst quartile
25.
0%
25.0%
25.0%
17.
6%
17.3%
38.9%
30.
4%
25.9%
18.5%
26.
5%
28.9%
20.5%
# Obs 3,915 1,073 962 1,880
Best quartile 25.0% 41.5% 16.6% 19.9%
Cash (equivalent)
Second quartile 24.9% 24.5% 29.6% 22.8%
holdings over total
Third quartile 25.1% 16.9% 28.1% 28.2%
debt
Worst quartile 25.0% 17.1% 25.7% 29.2%
# Obs 3,912 1,071 962 1,879
Best quartile 24.9% 28.2% 21.6% 24.7%
Second quartile 25.1% 21.3% 29.3% 24.9%
Altman Z-Score
Third quartile 24.7% 18.7% 25.3% 28.2%
Worst quartile 25.3% 31.7% 23.7% 22.2%
# Obs 2,744 779 730 1,235
Source: Form 5500 health plan filings and Capital IQ data.

36
5. CONCLUSION
The ACA was enacted in 2010 and has brought about far-reaching changes to health
care financing and coverage. This report and its counterparts from prior years offer
an opportunity to monitor any changes in employer-sponsored health benefit
coverage and its funding mechanism that employers have made in the first few years
since the ACA became law. While we identified several time trends, the changes
tended to be moderate, generally started prior to 2010, and largely flattened out in
recent years.
The number of health plans that filed a Form 5500 and the number of participants
that they cover is continuing to grow, i.e., there is no indication that employers are
dropping health benefit coverage. We note that most small health benefit plans are
exempt from filing a Form 5500, so that no conclusions should be drawn based on
this report with respect to small employers.
The overall distribution of funding mechanism did not change much since last year,
but some issues are noteworthy. At the plan level, self-insurance or mixed funding
increased slightly, as it has since 2013. This upward trend reverses an earlier
downward trend; the funding distribution in 2008 was very similar to that in 2016. At
the participant level, self-insurance or mixed funding slightly retreated from its long-
term gradual increase, but that change appears to be related to a definitional issue.
We reiterate that the changes were moderate.
The trend toward less stop-loss coverage (insofar as reported on Form 5500 filings),
which had steadied for self-insured plans since 2010, resumed for self-insured plans
in 2016 but may have stopped for mixed-funded plans in 2016. It is unclear whether
these findings reflect trends in overall stop-loss coverage—Form 5500 filings are
known to capture only a subset of stop-loss coverage.
Overall, the Form 5500, despite some known limitations, continues to be a useful
data source to better understand the type and range of health benefits that
employers provide to American workers. The relatively long history of these data can
help frame important policy debates surrounding these benefits. It can be anticipated
that future versions of this report will continue to document these important trends.

37
TECHNICAL APPENDIX
The definitions of funding mechanism rely upon the fields of Form 5500 and its
Schedules as outlined in Table 15.
Table 15. Data Fields Used to Determine Plan Funding Type
Source
Description
For
m 5500, Line 5
Total number of participants at the beginning of the plan
year
For
m 5500, Line 6d
Number of participants at the end of the plan year who are
active, retired, separated, or retired/separated and
entitled to future benefits
For
m 5500, Line 9a
The ‘‘funding arrangement’’ is the method for the receipt,
holding, investment, and transmittal of plan assets prior to
the time the plan actually provides benefits.
Plan funding arrangement (check all that apply)
1. I
nsurance
2. Section 412(e)(3) insurance contracts
3. Trust
4. General assets of the sponsor
For
m 5500, Line 9b
The ‘‘benefit arrangement’’ is the method by which the
plan provides benefits to participants.
Plan benefit arrangement (check all that apply)
1. I
nsurance
2. Section 412(e)(3) insurance contracts
3. Trust
4. General assets of the sponsor
Sch
edule A, Line 1e
Approximate number of persons covered at the end of the
plan year
Sch
edule A, Line 2a
Total amount of commissions paid
Sch
edule A, Line 2b
Total fees paid
Schedule A, Line 3e Organization code of agents, brokers, or other persons to
whom commissions or fees were paid:
1. Banking, Savings & Loan Association, etc.
2. Trust Company
3. Insurance Agent or Broker
4. Agent or Broker other than insurance
5. Third party administrator
6. Investment Company/Mutual Fund
7. Investment Manager/Adviser
8. Labor Union
9. Foreign entity
0. Other
Sch
edule A, Line 6b
Premiums paid to carrier

38
Source Description
Schedule A, Line 8
Type o
f benefit and contract types.
A. Health (other than dental or vision),
J. HMO contract,
K. PPO contract,
L. Indemnity contract,
M. Other
and
other codes for stop-loss, dental, vision, life,
disability, etc. More than one code may be checked
Sch
edule A, Line 8m Description of “Other” benefit and contract type
Schedule A, Line 9a(4) Total earned premium amount for experience-rated
contracts
Schedule A, Line 9b(3) Incurred claims
Schedule A, Line 9b(4) Claims charged
Schedule A, Line 10a Total premiums or subscription charges paid to carrier for
nonexperience-rated contracts
Schedule H, Line 2e Benefit payment and payments to provide benefits:
2e(
1) Directly to participants or beneficiaries, including
direct rollovers
2e(
2) To insurance carriers for the provision of
benefits
2e(
3) Other
2e(4) Total benefit payments
Sch
edule I, Line 2e Benefits paid (including direct rollovers)

39
DISCLAIMER
The views, opinions, and/or findings contained in this report should not be construed
as an official Government position, policy or decision, unless so designated by other
documentation issued by the appropriate governmental authority.
We call your attention to the possibility that other professionals may perform
procedures concerning the same information or data and reach different findings
than Advanced Analytical Consulting Group, Inc. (AACG) and Deloitte Financial
Advisory Services LLP (Deloitte) for a variety of reasons, including the possibilities
that additional or different information or data might be provided to them that was
not provided to AACG and Deloitte, that they might perform different procedures
than did AACG and Deloitte, or that professional judgments concerning complex,
unusual, or poorly documented matters may differ.
This document contains general information only. AACG and Deloitte are not, by
means of this document, rendering business, financial, investment, or other
professional advice or services. This document is not a substitute for such
professional advice or services, nor should it be used as a basis for any decision or
action. Before making any decision or taking any action, a qualified professional
adviser should be consulted. AACG and Deloitte, its affiliates, or related entities shall
not be responsible for any loss sustained by any person who relies on this
publication.
This document is the 2019 Self-Insured Group Health Plans Report, Deliverable 2.3
pursuant to Option Year Four of Contract DOLJ139335145 (Appendix B for Self-
Insured Health Report).
